Levolytics Research #7
Edition #7 | Written as of November 10th, 2025

Introduction
Welcome to the newest edition of Levolytics Research! The home of actionable data. If you enjoy the research, please subscribe and share our work with friends and colleagues.
Market Update
The US government remains shut down, with some signs of progress emerging in the Senate
Bitcoin plunged below $100,000 after bulls ran out of energy to defend the $108,000 level
11/3/2025 Report (Click here to view)
Question of the Week: What impact do Americans play in price discovery?
Our Take on the Market
Macro Analysis
Metric Description:
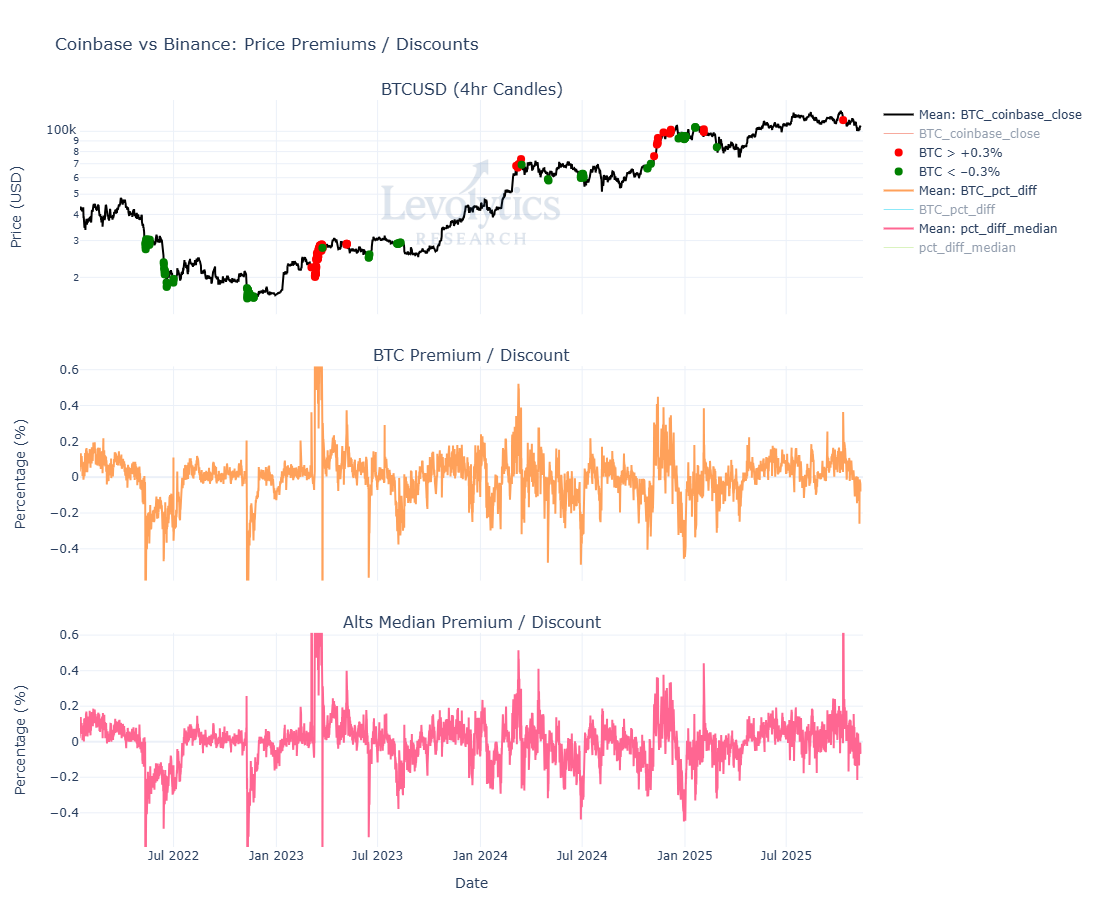
Subplot 1: BTCUSD Price
Red dots = BTCUSD on Coinbase is trading > 0.3% above the BTCUSDT price on Binance (large premium in Coinbase price)
Most recent red dot = October 10th, 2025
Green dots = BTCUSD on Coinbase is trading < -0.3% below the BTCUSDT price on Binance (large discount in Coinbase price)
Most recent large discount = -0.26% = November 9th, 2025
Note: not large enough for green print but still considered large
Subplot 2: BTCUSD (Coinbase) vs BTCUSDT (Binance) Premium (+ values) / Discount (- values)
Large positive (Coinbase premium) or negative (Coinbase discount) values are areas of disorder in price discovery, which can also be viewed as signals of panic / euphoria
Subplot 3: ALTUSD (Coinbase) vs ALTUSDT (Binance) Premium (+ values) / Discount (- values)
This calculates the median premium / discount across 200+ pairs that are on both Coinbase and Binance
** Note: All Binance USDT prices have been converted to USD.
Metric Takeaway:
Markets top and bottom at the extremes of human emotion. In crypto, we can identify these extremes using:
Funding rates
Open interest
Volume
Returns
The list goes on, and in the case of the Coinbase premium / discount, we can see the range of human emotions at play when the Coinbase premium / discount blows out:
Historical tops when Coinbase premium gets too high
Historical bottoms when Coinbase discount gets too low
On twitter, you will see various market participants getting excited (depressed) about the Coinbase price leading (lagging). However, the truth is that too much in either direction isn’t a good thing.
That being said, the Coinbase discount printed a large discount on the news that the there has been progress on reopening the government on November 9th. We continue to monitor this as a possible pivot point.
Metric Description:
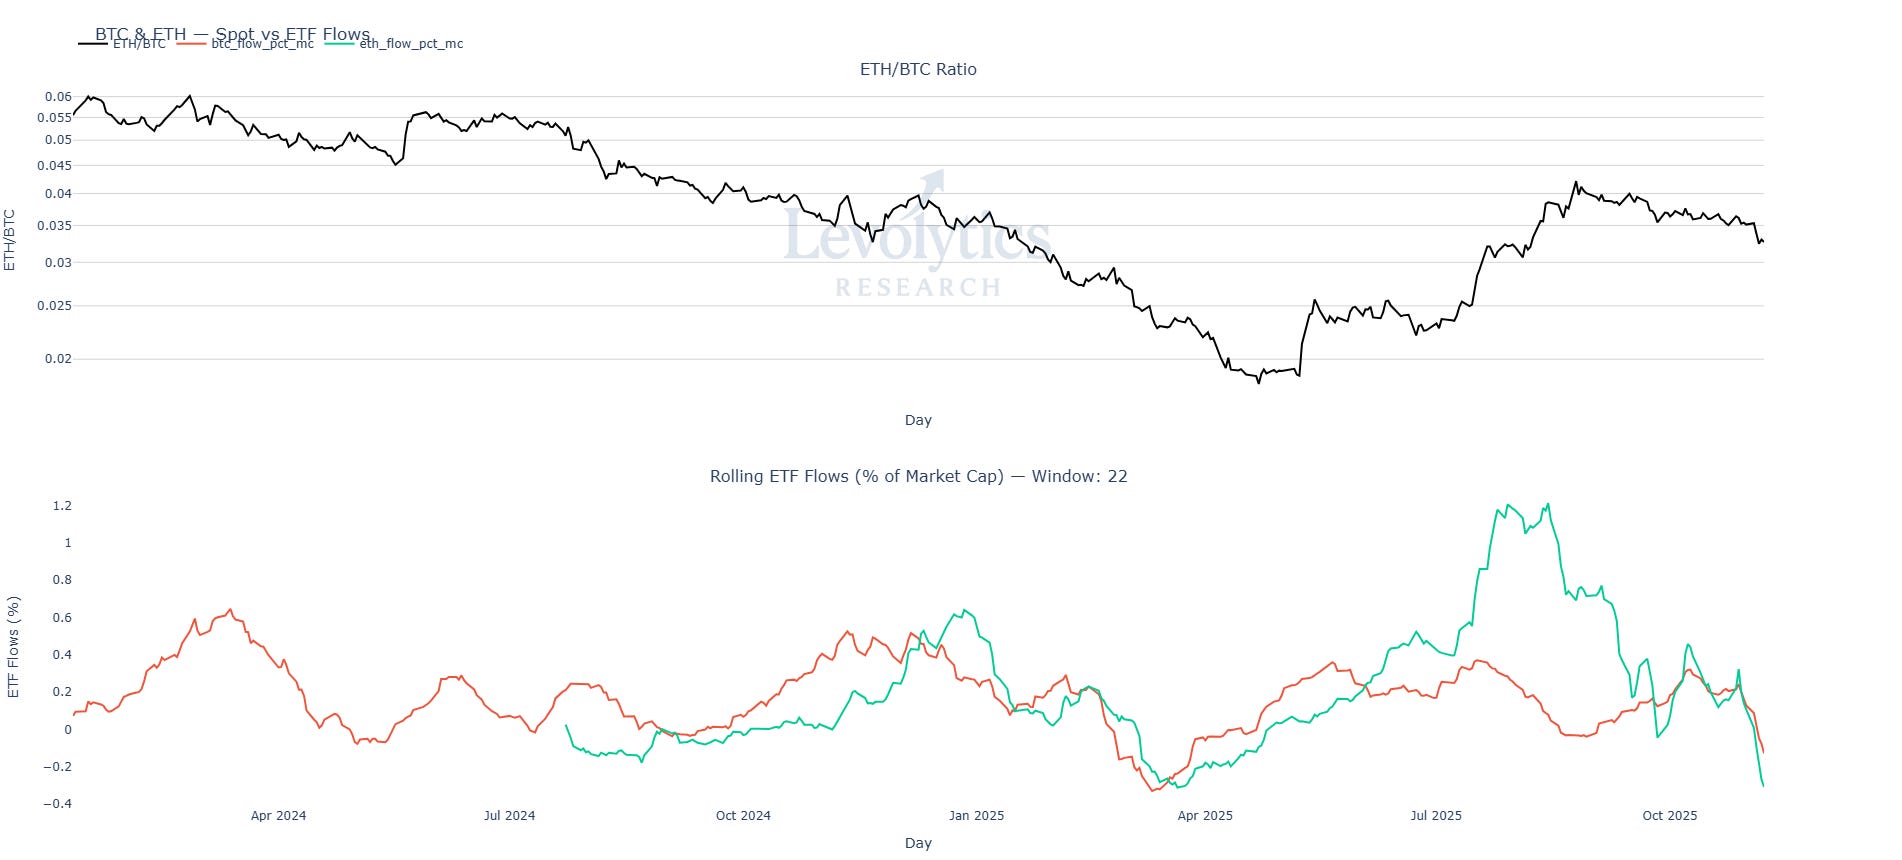
Subplot 1: ETHBTC Price
Subplot 2: BTC Monthly ETF Flows (% of BTC Market Cap) vs ETH Monthly ETF Flows (% of ETH Market Cap)
Rolling 22-day sum of ETF flows used to approximate for the number of business days in a month
BTC Largest Value = ETF flows = 0.65% of Market Cap
BTC Smallest Value = ETF flows = -0.33% of Market Cap
ETH Largest Value = ETF flows = 1.2% of Market Cap
ETH Smallest Value = ETF flows = -0.3% of Market Cap
Metric Takeaway:
Once again, we see American flows at play. After ETH ETF flows overtook BTC’s ETF demand in early June on a market cap adjusted basis, the ETHBTC price proceeded to increase by approximately 75% in the next 2.5 months.
We also have another opportunity here to identify what seems like an extreme level for the ETH ETFs - the price topped on 1.2% of market cap hitting the ETF tape on a rolling monthly basis. We understand that the sample size is small, but this is a piece we can combine with other factors to identify markets potentially exhausting available demand on lower timeframes.
Metric Description:
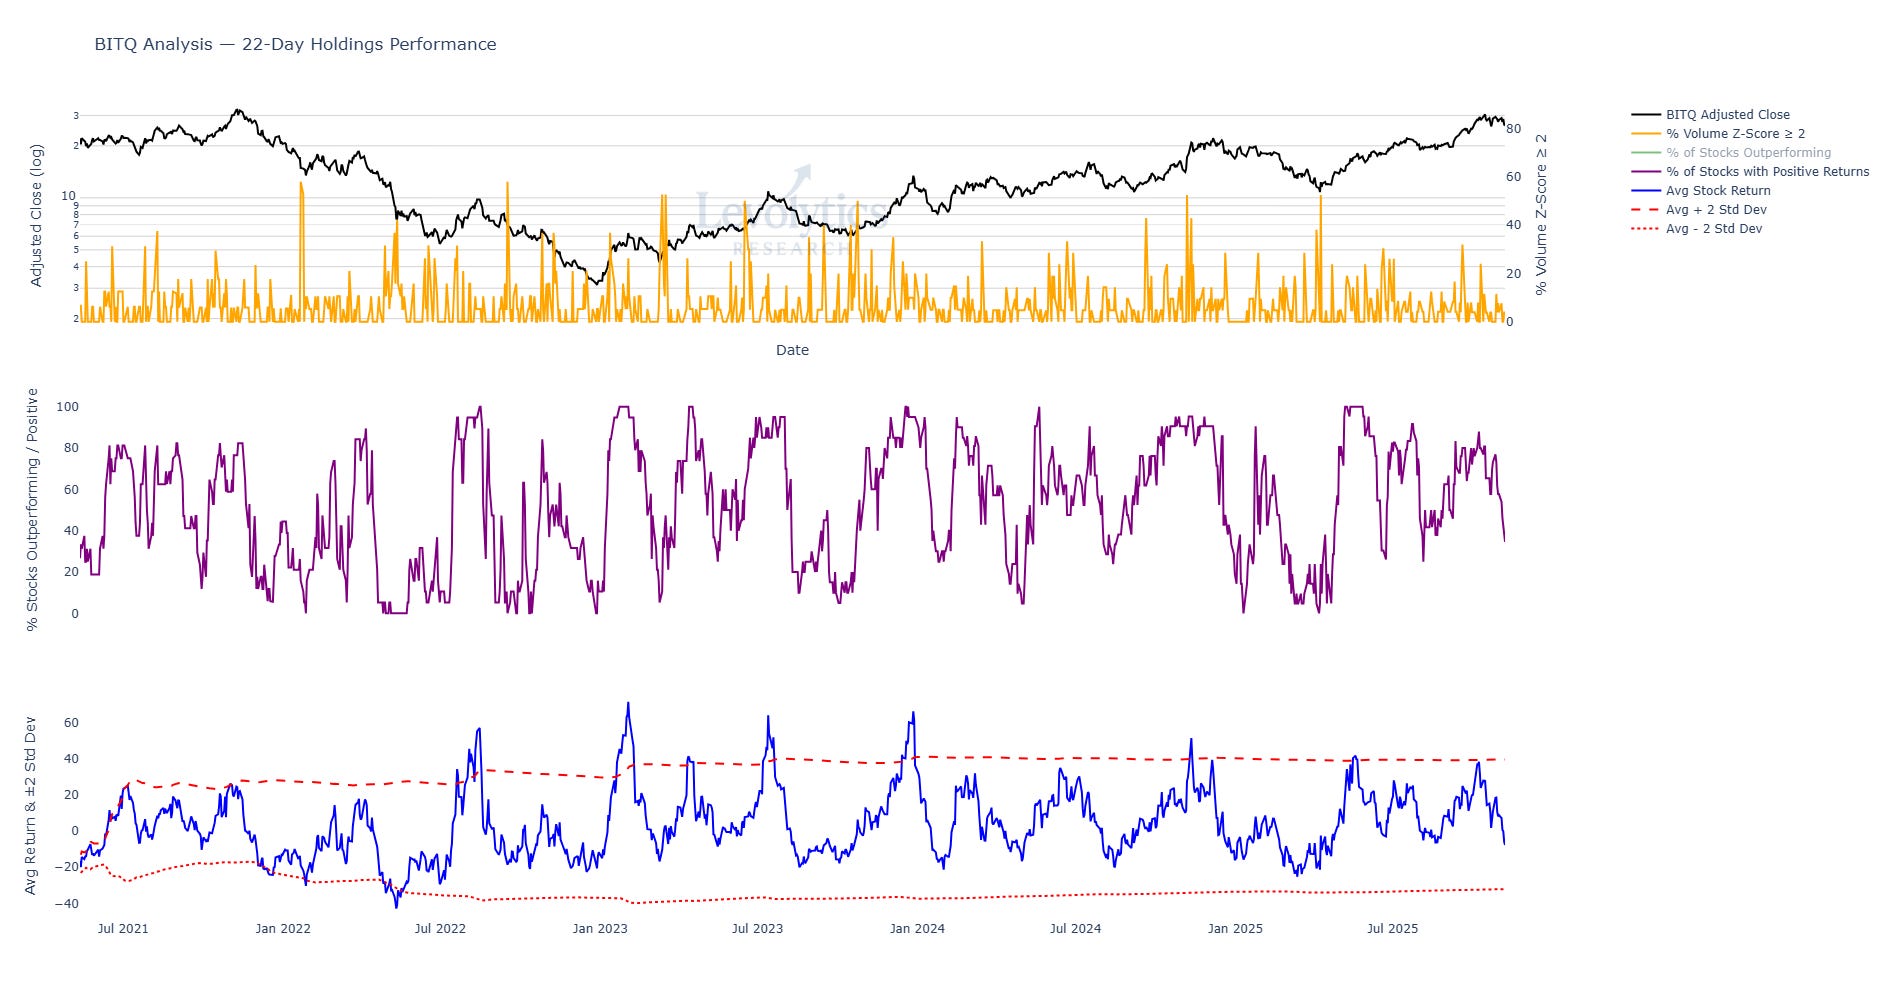
Subplot 1: BITQ Price vs % of Stocks within BITQ that have abnormally large volume
Uses a 22-Day z-score across all pairs, then calculates % of pairs with larger than 2 z-score
Subplot 2: % of Stocks within BITQ with positive returns over the past month
1 month = 22 business days
Current value = 34%
Subplot 3: Average rolling 22-Day % return across all stocks within BITQ vs +/- 2 standard deviations outside the lifetime mean
Current value = -7.7%
Touched top band October 8th, 2025 at 38%
Bottom band has been out of play for a long time - bottoms have been more consistently taking place around -20%
Metric Takeaway:
We’ve included stock data from the most well-known American crypto equities ETF to show that a lot of this is one big trade.
Returns for crypto stocks had overextended prior to the October 10th bloodbath. They’re now trading at levels they’ve been bottoming at since June.
Note: While this line is hidden on the chart, we want to point out that on bullish impulses BITQ outperforms most of the stocks within its holdings, and vice-versa to the downside.
Micro Analysis
Metric Description:
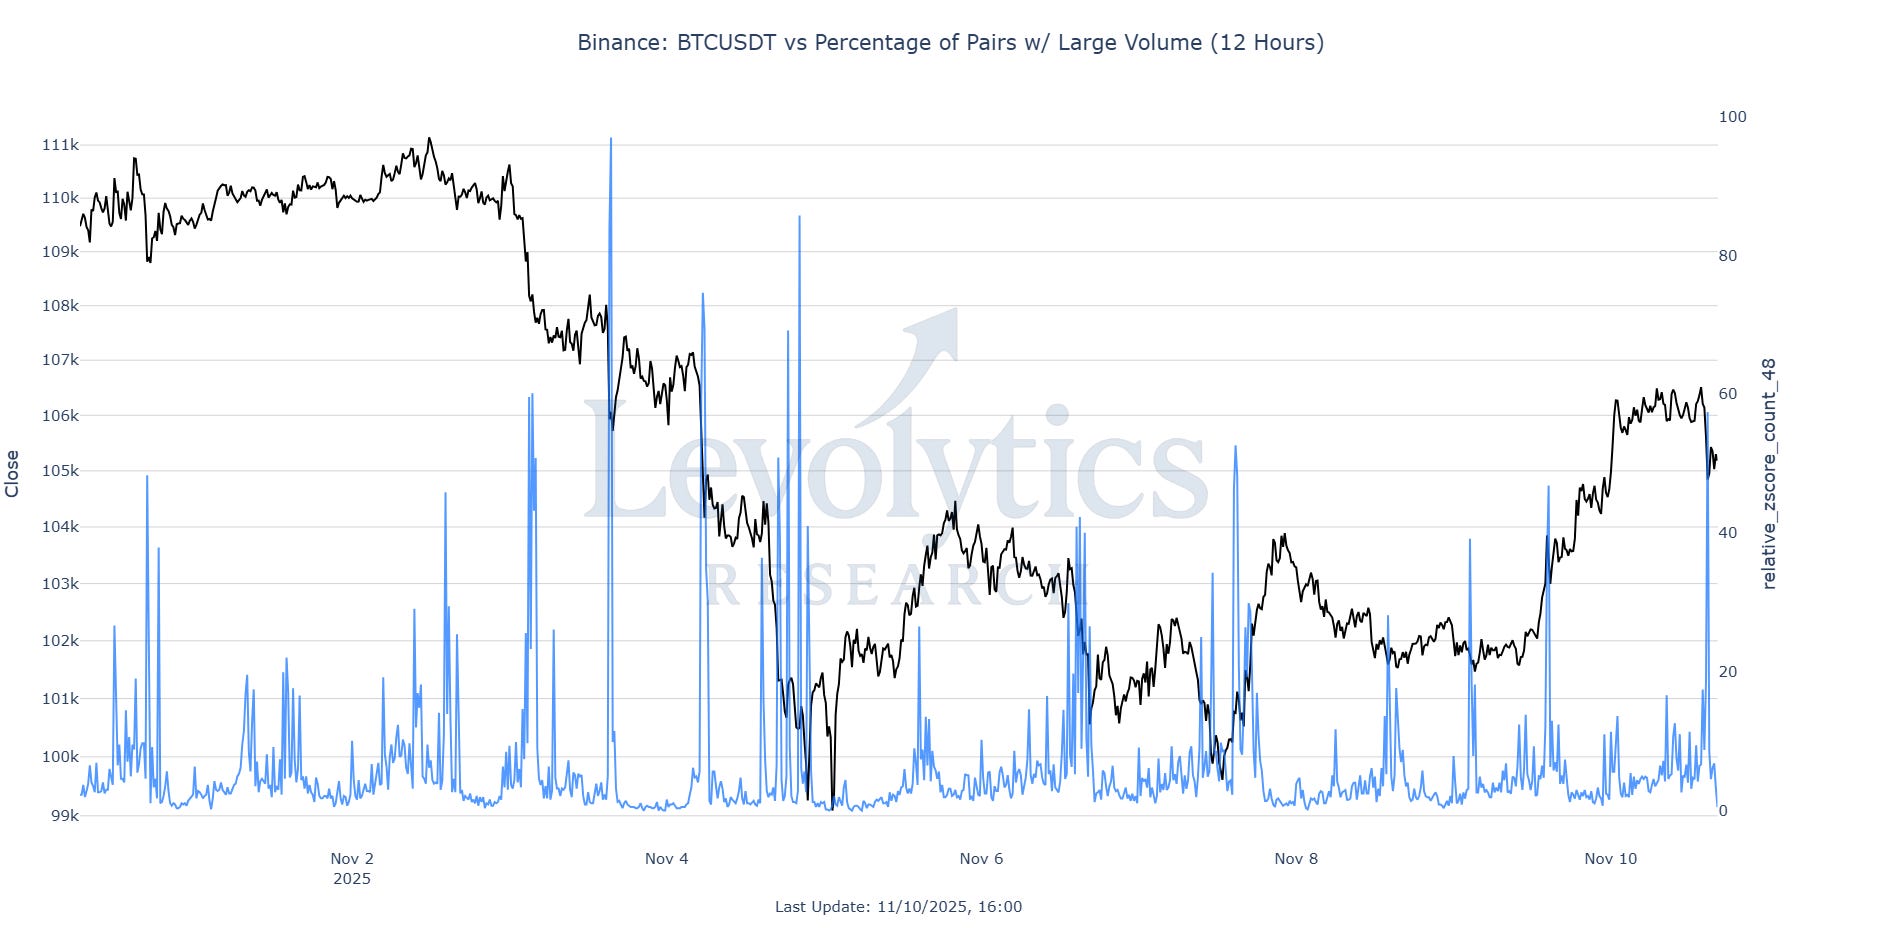
% of perpetual swap pairs with abnormally large volume on Binance
Uses a 12 hour z-score across all pairs, then calculates % of pairs with larger than 2 z-score
Value at US open = 57%
Metric Takeaway:
Nodes with large volume prints across many pairs are usually intraday areas of interest. This large print creates a possibility for an early Monday bottom for those in the “front-run the government reopening pump” camp.
If you also take a closer look at the chart - this simply looks like a high volume dump into a key horizontal level on lower timeframes.
At Levolytics, we do not trade using this signal, but we do watch it closely during bearish / consolidation periods as the tendency for price to pinball between high volume nodes is more pronounced compared to bullish conditions.
Our Approach
Takeaway
The analysis above highlighted the following:
You can identify extremes in price action by identifying American preferences exerting themselves via price discrepancies between foreign exchanges
This took place with a bearish signal on October 10th, and we just had a fairly large print on November 9th
Extremes and trends can also be identified via American money flows - which are transparently shown in ETFs. While the signal might be muddied on a day to day basis, it becomes more clear as you zoom out
American crypto equities trade as tradfi Bitcoin beta, and can be used to support bull or bear theses
Allocation Strategy: We believe a clean break below $100,000 would be a signal that would make us consider the possibility of an extended Bitcoin bear market. Naturally, this would not be a great outcome for altcoins either.
We are still trying to take stabs at quality high beta assets while also maintaining a healthy cash position.
We also still believe that this market has a lot of potential for upside, but are reliant on our execution strategy to ensure we don’t stubbornly fight the tide.
Macro Approach
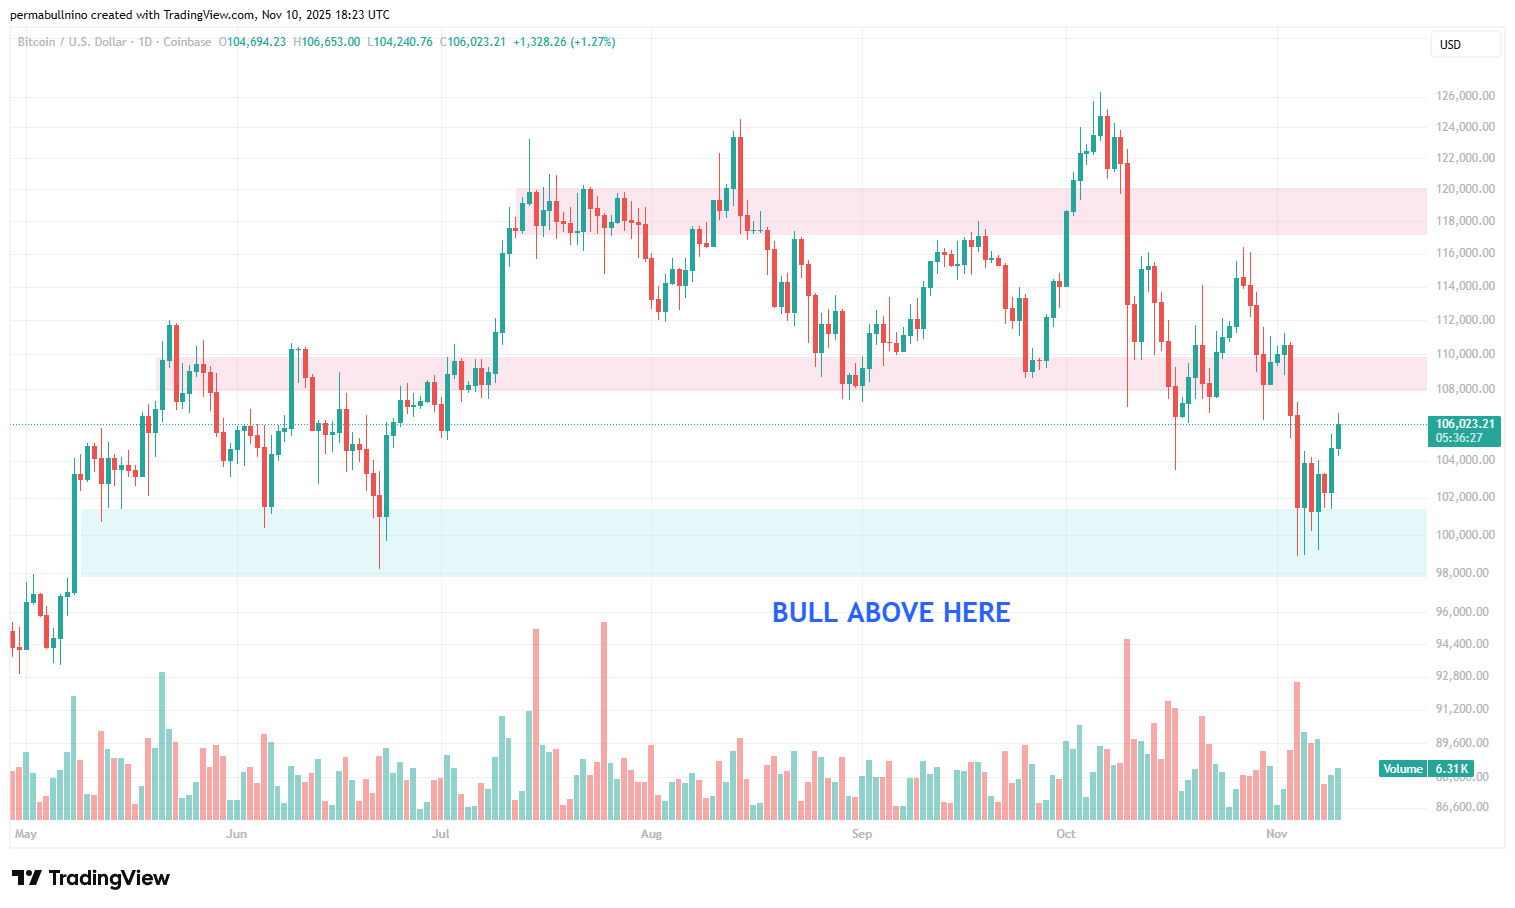
Keeping things simple here - $100,000 is the line in the sand for Bitcoin. A convincing break below the blue box then it’s probably time to start selling our mixtape on the Venice boardwalk.
Micro Approach
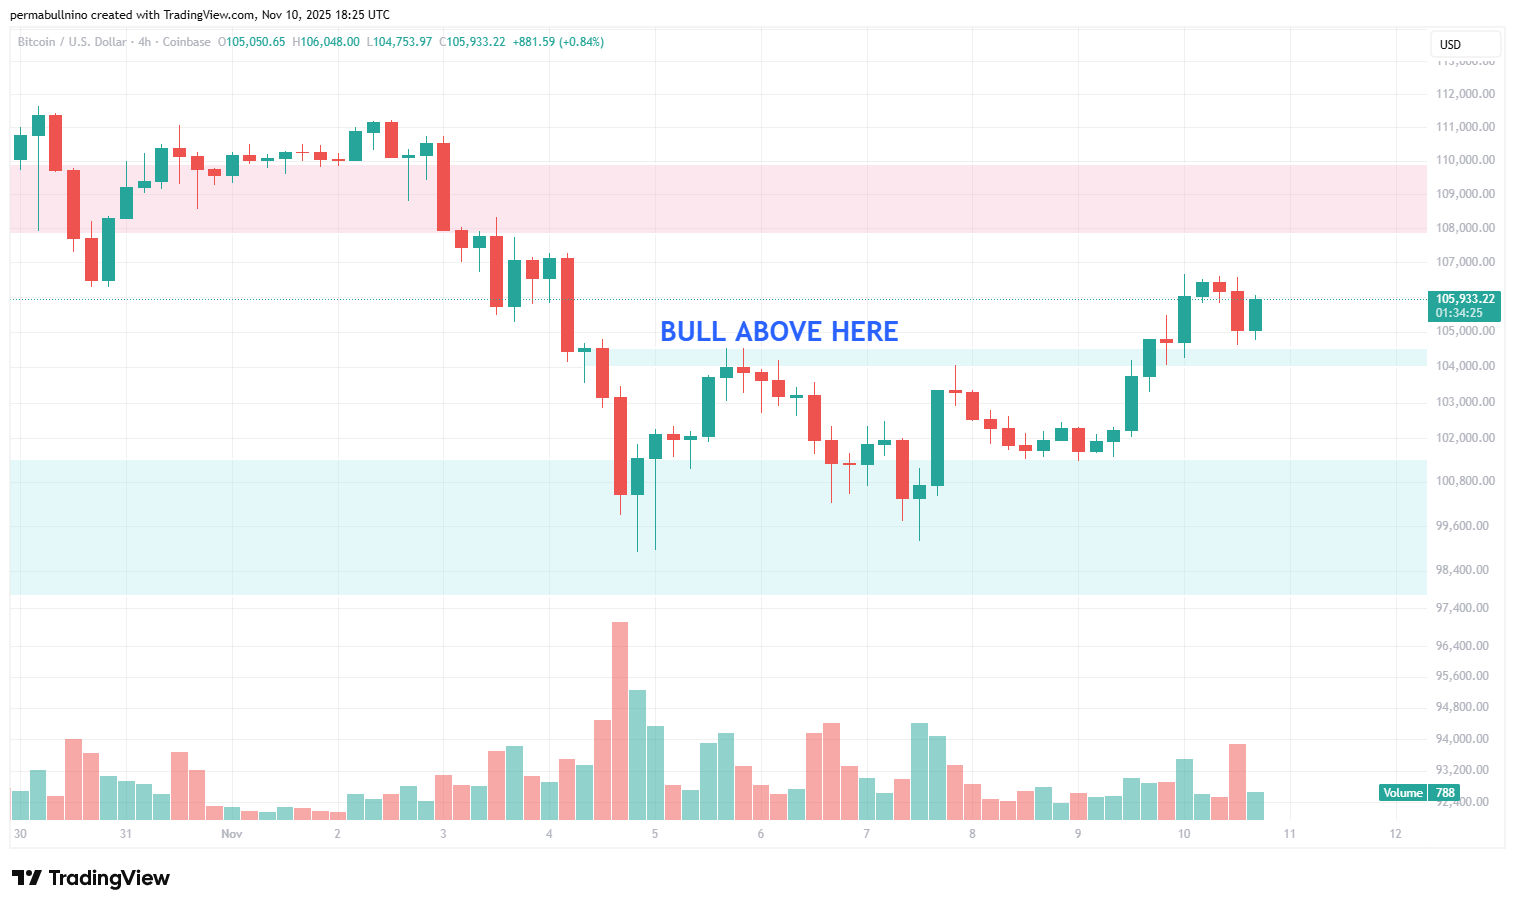
We want to continue to keep things simple on lower timeframes - it’s reasonable to maintain a bullish bias as long as BTC holds above the $104,000 level. Just don’t forget that $108,000 is a technical resistance level.
Strategy
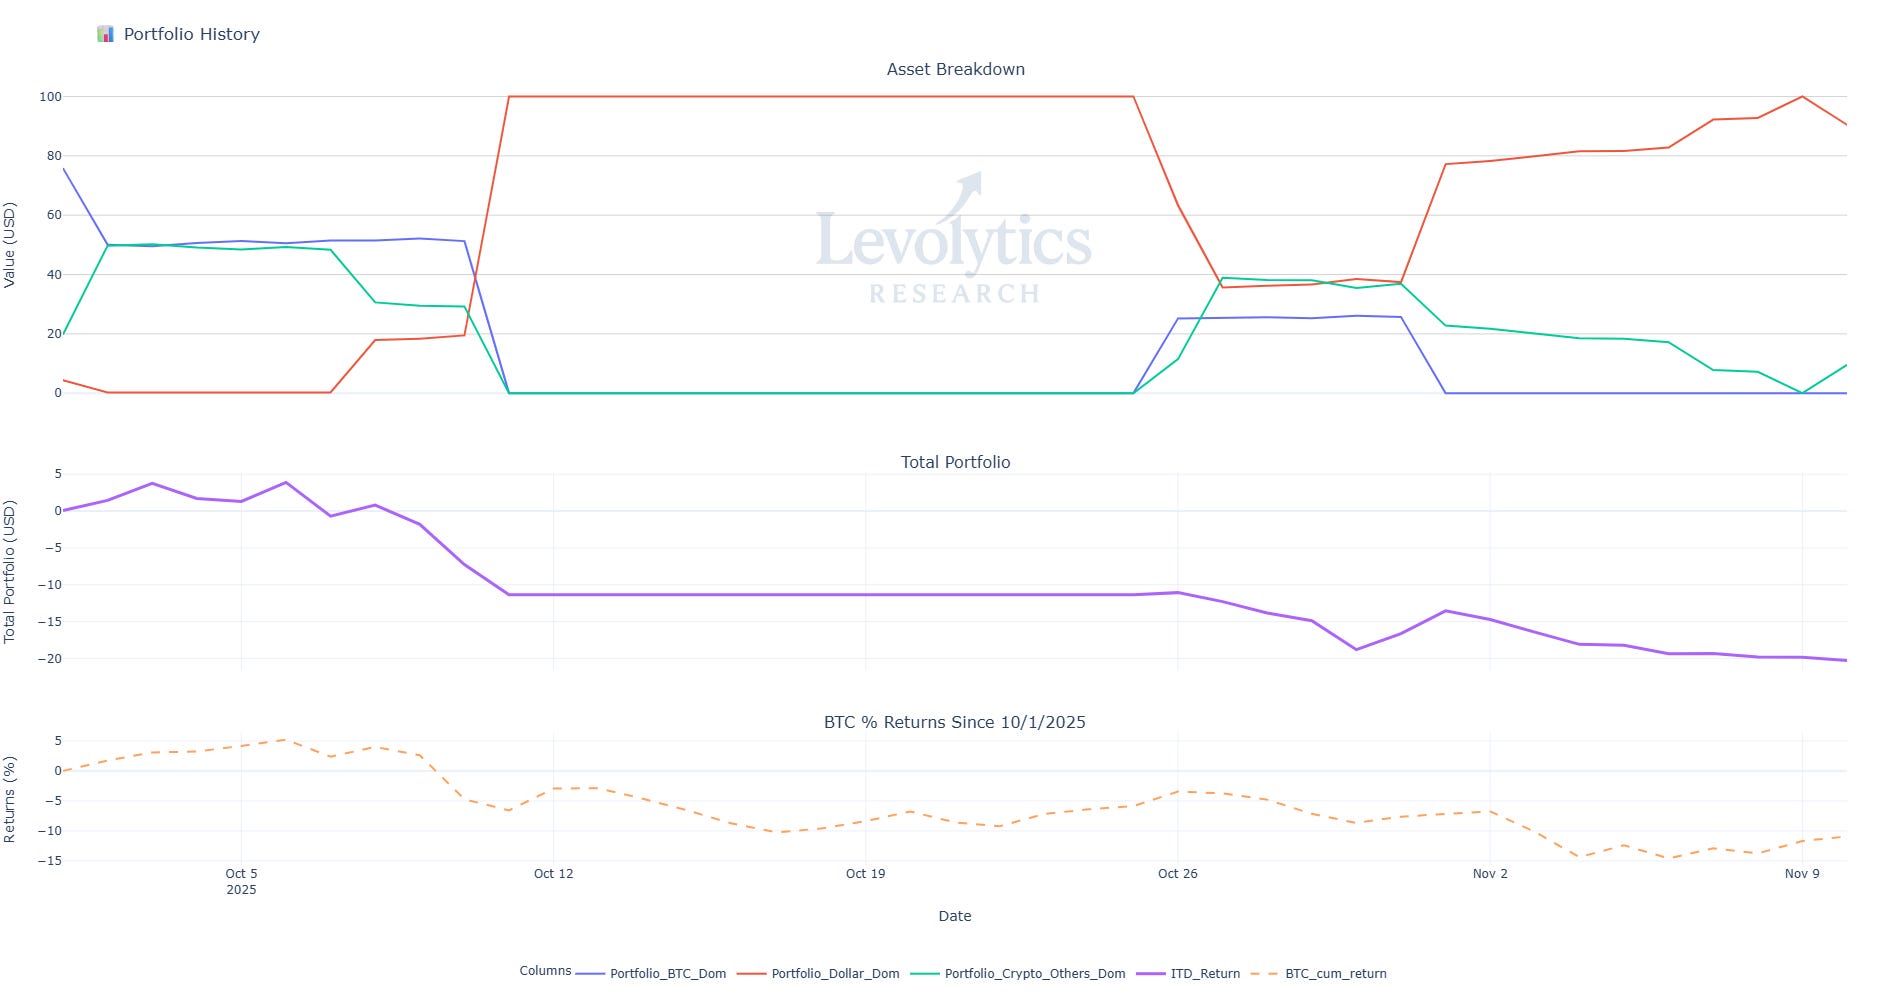
Our current portfolio composition is as follows:
% of Portfolio in BTC = Blue line
Current value: 0%
% of Portfolio in Crypto Alts = Green Line
Current Value: 9.55%
% of Portfolio in Cash = Orange line
Current value: 90.45%
Inception to Date Returns = Purple line
Current value: -19.71%
BTC Returns Since Inception = Dotted Orange Line
Current value: -11.10%
Note: Levolytics Research liquid strategy went live October 1, 2025.
Explanation: We aren’t afraid to call a spade a spade. It has been a difficult 30 day stretch for long-biased, momentum strategies. As we have mentioned in previous weeks, the market has presented pockets of opportunity if you know where to look. As we continue to adhere to our strategy, we have reduced our exposure incrementally, holding small positions in a couple outperforming alts as we (anxiously) await the return of more favorable conditions.
Sign Off
Price action on Coinbase compared to Binance can often act as a pivot point when the price on one exchange materially deviates from the other.
Significant upticks in ETF inflows as a % of an asset’s market cap can lead to meaningful outperformance. Something to keep an eye on as the overall number of ETFs continues to increase.
Crypto-related stocks have had a momentum reset as well, reaching a level historically suitable for forward positive returns.
It has been a tough market. We remain defensive until we see signs of positive momentum and bullish price action returning.
Until next week,
Disclaimer
The performance results presented herein reflect proprietary trading activity conducted with internal capital only. No external capital is managed, accepted, or solicited. These results are unaudited and are provided solely for informational and research purposes.
Performance data represents the return on internal capital based on realized and unrealized gains and losses, net of trading fees and transaction costs, but before any taxes or potential operating expenses. The methodology used to calculate performance has been applied consistently; however, results have not been verified by any independent party.
Past performance is not necessarily indicative of future results. All investments involve risk, including the potential loss of principal. The information contained herein does not constitute an offer to sell or a solicitation of an offer to buy any security, investment fund interest, or other financial instrument.
Any opinions, estimates, or forward-looking statements are subject to change without notice and are provided for illustrative or educational purposes only.