Levolytics Research #6
Edition #6 | Written as of November 3rd, 2025

Introduction
Welcome to the newest edition of Levolytics Research! The home of actionable data. If you enjoy the research, please subscribe and share our work with friends and colleagues.
Market Update
BTCUSD tested both the top and bottom of the lower timeframe range by dropping from $115,000 down to $105,000
Dispersion for select assets remain (Dino coins, Base coins, AI coins, etc.)
Overall sentiment remains negative across market participants
10/27/2025 Report (Click here to view)
Question of the Week: Is there a way to be long this market while BTC chops everyone to death?
Our Take on the Market
Macro Analysis
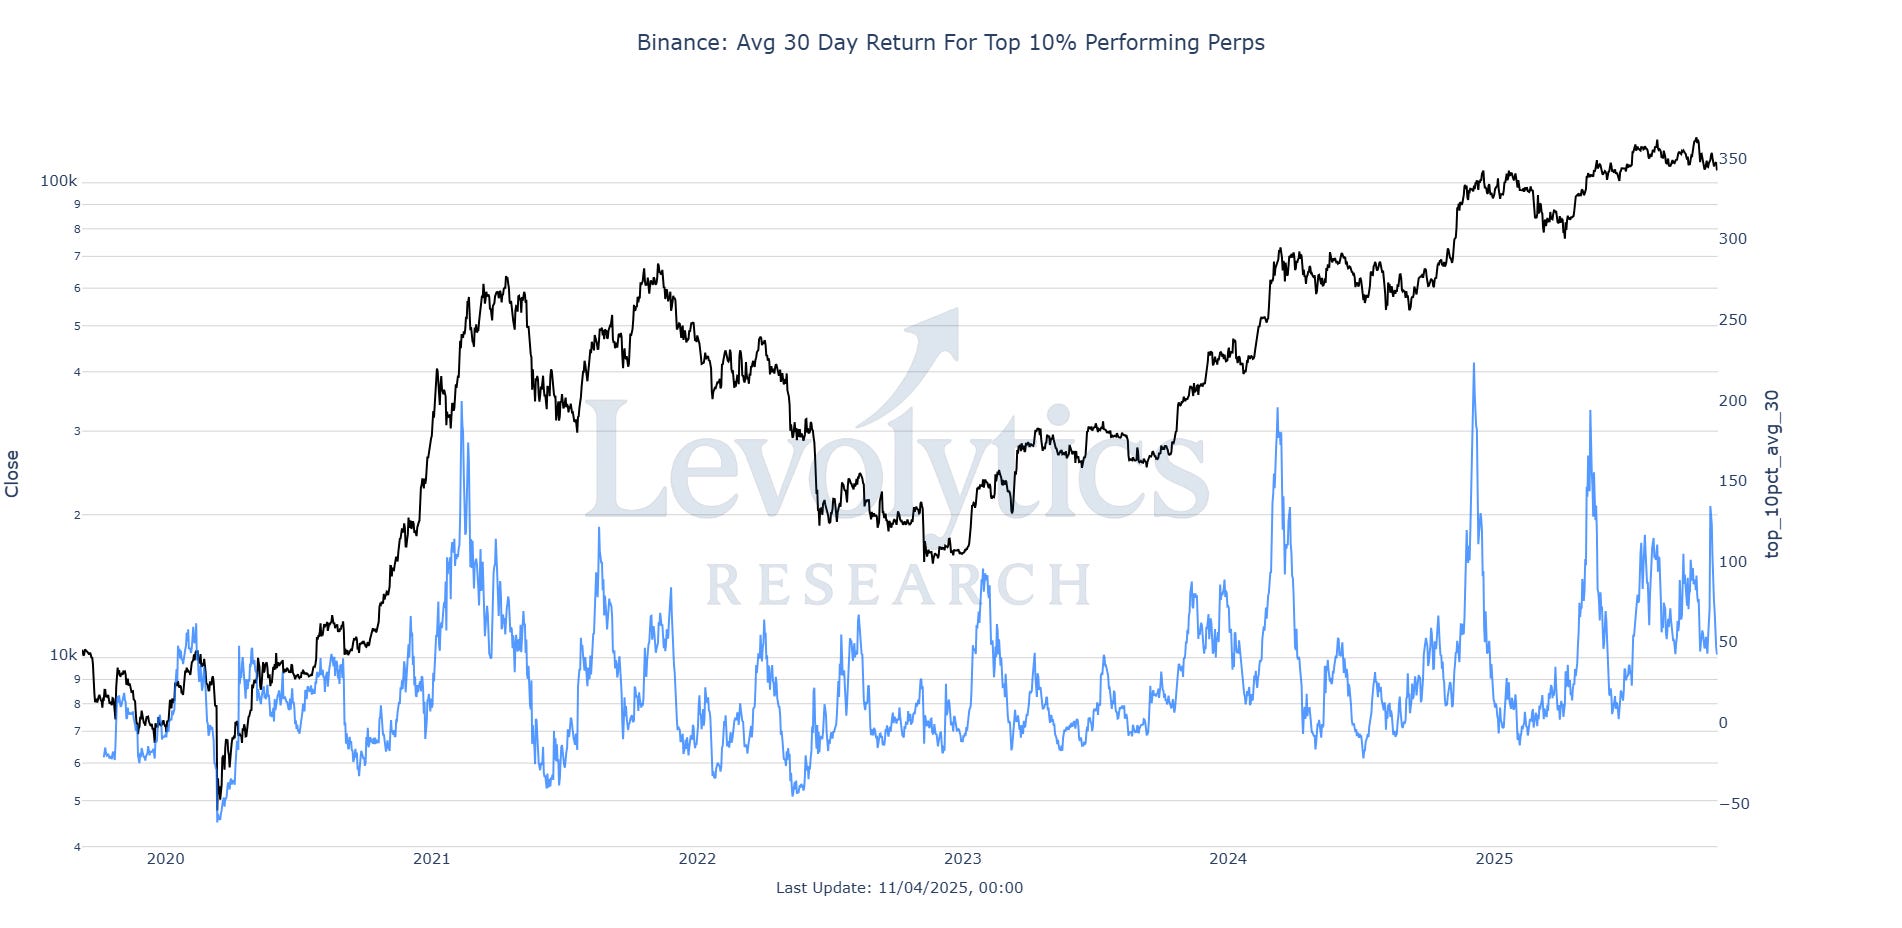
Metric Description:
The average 30-Day % return of the top 10% performing perpetual swap pairs on Binance
Current value = 43%
Values since BTCUSD bottomed in November 2022 have ranged between -15% to 200%
Metric Takeaway:
This chart is included to make the following statement: markets are filled with opportunity - even during downturns there are usually ways to make money by longing assets showing relative strength to the market. Identifying these assets and developing a strategy to navigate murky market waters are the hard part.
This is admittedly more difficult than remaining heavy cash and waiting for easy mode to reveal itself. However, there are unique periods where select assets can front-run a market-wide move to the upside - which is where playing this game becomes worthwhile.

Metric Description:
Subplot 1: Average lifetime % returns since getting added as a USD pair to Coinbase
Plotted Indices: Base assets average rank, SOL Memes average rank, OG DeFi average rank, & Dino coins average rank
Base Assets (Blue line) = 23
SOL Memes (Red line) = 184
OG DeFi (Green line) = 126
Dino Coins (Purple line) = 68
Top performing indices are Base assets and Dino coins, which have rebounded emphatically since the Summer
Base assets performing well is likely not surprising to most market participants, as Coinbase has ample reasons to make sure that their ecosystem is well supported
Dino coins’ performance since day 1 listings are the most surprising
The chart above shows that these were better day 1 listing purchases on average than Memecoins and OG DeFi
Subplot 2: % of USD pairs on Coinbase that have > 0% returns since day 1 listing
Current value = 11.6%
Subplot 3: Total number of USD pairs listed on Coinbase
Current value = 336
Metric Takeaway:
The most important takeaway from this chart is that we want to zoom in on the baskets of assets that are outperforming the herd. In this example, the assets we want to possibly own are the Base assets and Dino coins.
The last thing anyone wants to do is play the trading game on a higher level of difficulty than is necessary, where you’re going against the following:
~300 assets of 336 on Coinbase have negative returns since launching on Coinbase
BTCUSD current 30-Day % returns are negative, and is trading at the bottom of a multi-month range
AND you’re also trading the assets of indices that are underperforming
By isolating the best performing indices, you maximize your chances of profitability.

Metric Description:
Subplot 1: Average 30-Day % Return for Base Chain Index vs Bitcoin 30-Day % Return
Base Chain Index = +26%
Bitcoin = -12%
Subplot 2: Average 90-Day % Return for Base Chain Index vs Bitcoin 90-Day % Return
Base Chain Index = +17%
Bitcoin = -5%
Subplot 3: Snapshot of 90-Day % Returns, Mean 90-Day % Return for Index, % of Assets within Base Chain Index w/ Positive Return & Average Beta for Base Chain Index
4 of 5 assets in the Base Chain Index have outperformed Bitcoin over the past 90 days, while trading with a 2.23 beta to Bitcoin on average (i.e. Base Chain Index assets move +/-2.23% for each Bitcoin +/-1% move
Subplot 4: Rolling 30-Day Average Beta for Base Chain Index Assets
The beta for Base Chain Index has consistently hovered around 2
Metric Takeaway:
It’s not enough for certain alts to outperform others, it’s also important that they have positive returns against both BTC and USD. Furthermore, we need to consider various timeframes to gauge the levels of strength certain sectors might be showing. After that, it’s important to ensure that the average is not getting muddied by 1 huge outlier. In the case of the Base Chain Index, 80% of pairs have positive returns against BTC over the past 90 days.
Once a sector and favorites within it are selected, we can finally take risk into account - in the case of the Base Chain Index a Beta of 2.23 signals to us that owning this basket comes with approximately 2x as much volatility. When considering sizing and overall portfolio exposure, this must be taken into account - most people likely are not interested in taking on 2x volatility by going max long when sentiment is in the gutter and BTCUSD is chopping around +/- 10% per week.
Note: this is not a recommendation to buy this basket or particular assets shown, but rather an exercise to talk readers through our reasoning when evaluating risk/reward.
Our Approach
Takeaway
The analysis above highlighted the following:
It is possible to consistently make money on the long side by owning outperformers. Is this easy? No. But it is possible, and a game worth playing under certain circumstances.
The market is not in easy mode right now. Do not attempt to long sectors that are consistently underperforming while Bitcoin isn’t inspiring much confidence
Find the best assets in the best sectors. Then come up with a plan to deploy while taking risk / volatility into account
Allocation Strategy: We still believe it is justified to maintain a bullish bias while Bitcoin sits above / around $108,000 on higher timeframes despite the shaky price action. However, we believe this must be done with a measured level of risk.
We are particularly interested in owning outperforming altcoins and adjusting our sizing down to adjust for volatility / keeping cash available for potential further downside.
Macro Approach
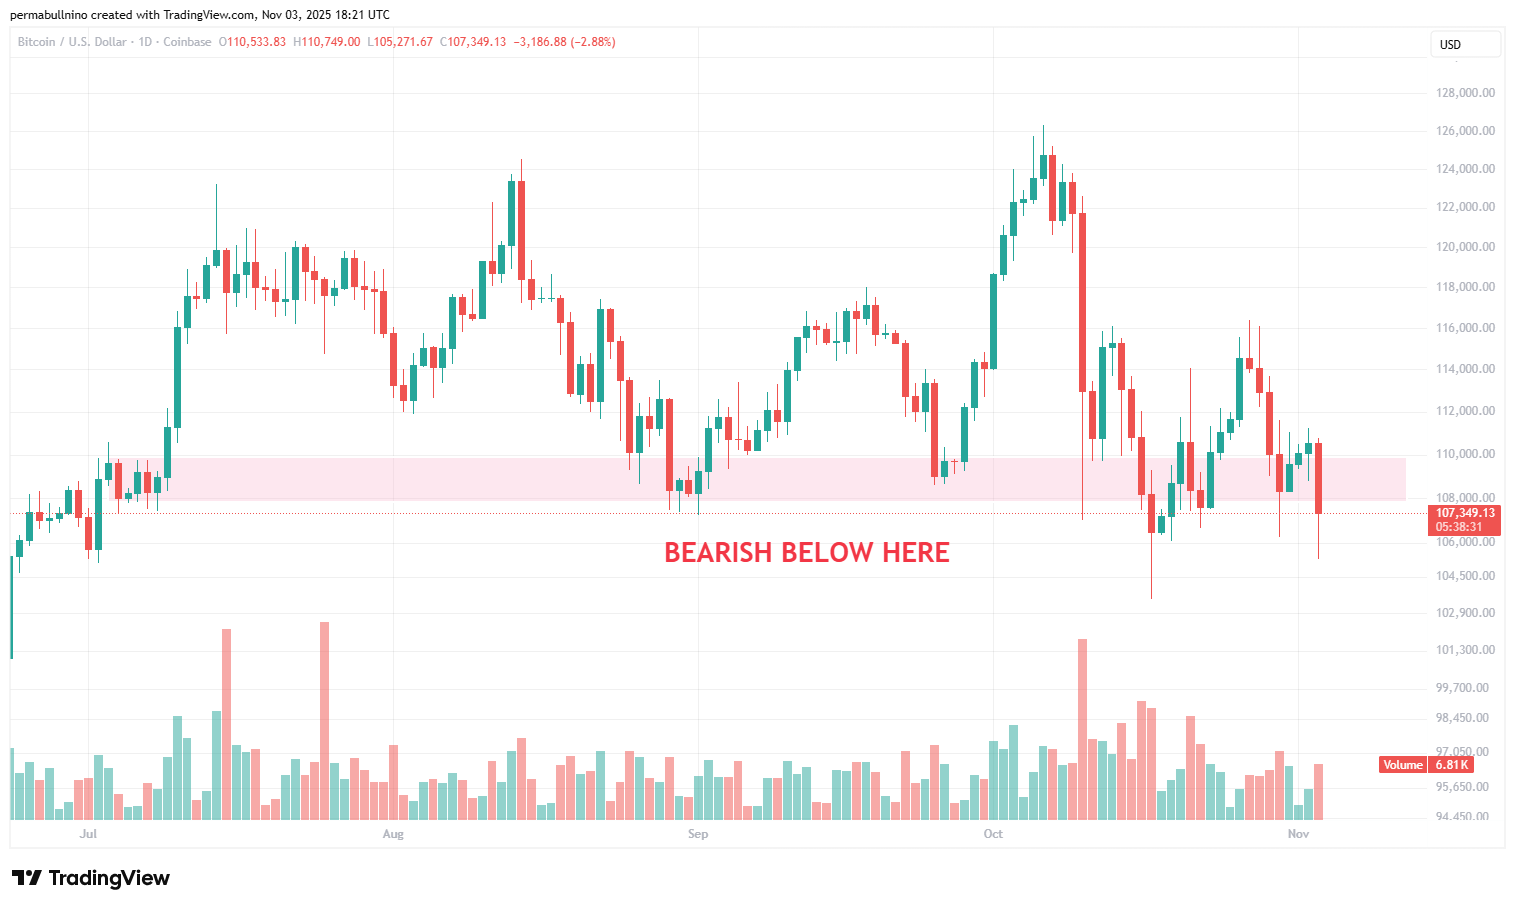
Bitcoin has tested the $110,000 to $108,000 zone repeatedly over the past 3 weeks. There is clearly a lot of demand at this level, but the more it gets tested the more likely it breaks down. Nonetheless, as of today it’s holding the line in the sand.
Micro Approach

Our Bitcoin bull caps go back on with a reclaim of the $113,500 level. Until then, range traders rejoice.
Strategy
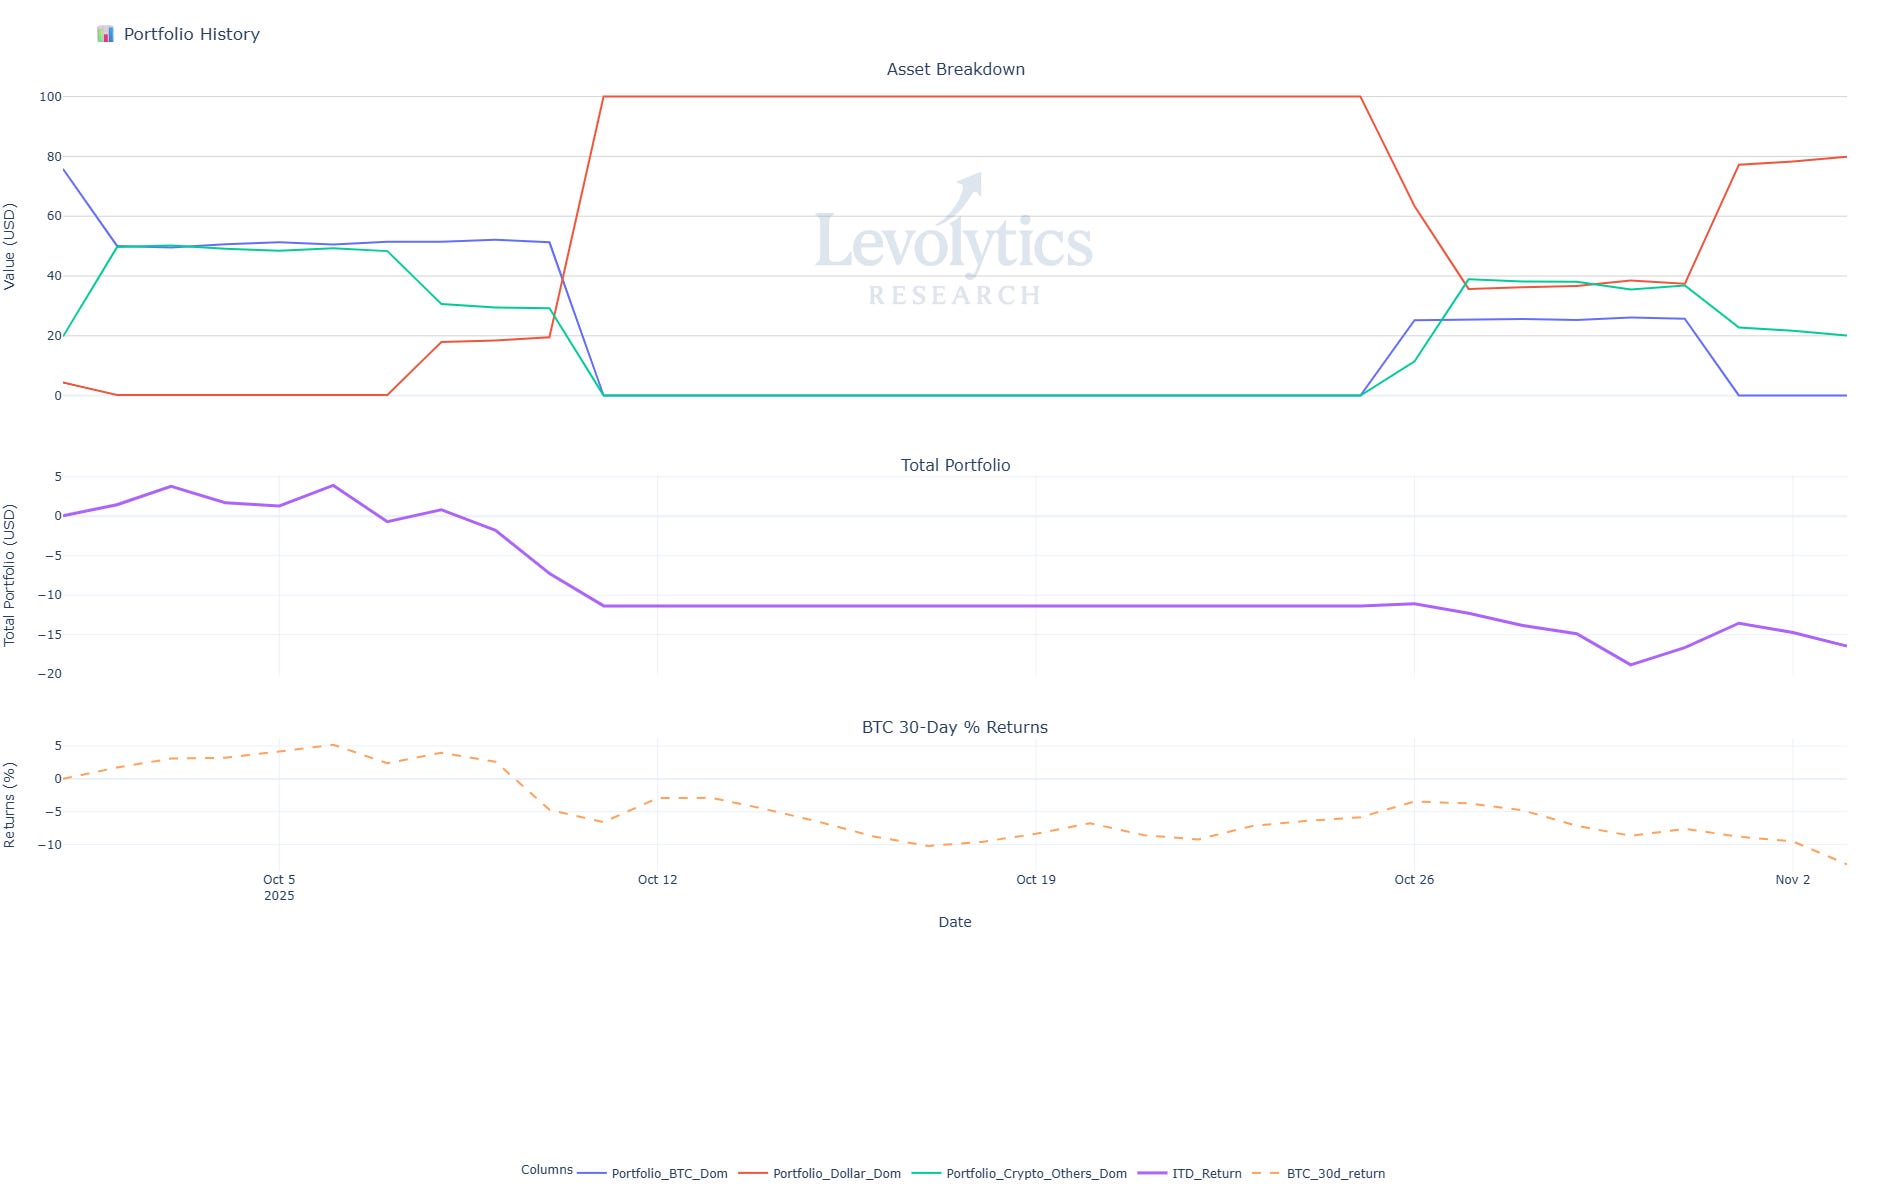
Our current portfolio composition is as follows:
% of Portfolio in BTC = Blue line
Current value: 0%
% of Portfolio in Crypto Alts = Green Line
Current Value: 20.55%
% of Portfolio in Cash = Orange line
Current value: 79.45%
Inception to Date Returns = Purple line
Current value: -15.98%
BTC 30-Day % Returns = Dotted Orange Line
Current value: -12.34%
Note: Levolytics Research liquid strategy went live October 1, 2025.
Explanation: At Levolytics, we believe all strategies should be iterative and constantly improved upon. One major change we made over the past week on the risk management front was to beta-adjust our alt holdings relative to Bitcoin, which is the de-facto benchmark for all liquid crypto participants. As our momentum-based strategy continues to signal risk-off for BTC, we increased our cash position to approximately 80% of the portfolio. Our select alt holdings, which have been performance outliers, allow us to retain healthy beta-adjusted upside exposure while being insulated from a continued market-wide drawdown.
Sign Off
BTCUSD has exhibited choppy, difficult price action with a downward skew.
That being said, the market has presented pockets of opportunity if you know where to look.
With proper sizing and risk management, these opportunities can be exploited as we await the return of easy mode.
We remain convicted in our view that a reclaim of $113,500 sets up well for continuation higher. In the interim, pick your spots and manage your risk.
Until next time,
Disclaimer
The performance results presented herein reflect proprietary trading activity conducted with internal capital only. No external capital is managed, accepted, or solicited. These results are unaudited and are provided solely for informational and research purposes.
Performance data represents the return on internal capital based on realized and unrealized gains and losses, net of trading fees and transaction costs, but before any taxes or potential operating expenses. The methodology used to calculate performance has been applied consistently; however, results have not been verified by any independent party.
Past performance is not necessarily indicative of future results. All investments involve risk, including the potential loss of principal. The information contained herein does not constitute an offer to sell or a solicitation of an offer to buy any security, investment fund interest, or other financial instrument.
Any opinions, estimates, or forward-looking statements are subject to change without notice and are provided for illustrative or educational purposes only.