Levolytics Research #5
Edition #5 | Written as of October 27th, 2025

Introduction
Welcome to the newest edition of Levolytics Research! The home of actionable data. If you enjoy the research, please subscribe and share our work with friends and colleagues.
Market Update
Fear in the market has fizzled out, as evidenced by BTCUSD now trading at the lower timeframe range high of $115,000 as bulls regain their footing
ZCash (ticker: $ZEC) has been joined by Virtuals (ticker: $VIRTUAL) in the category of assets that have violently lifted from their 10/10/2025 lows
These are examples of willing risk takers remaining in the market, despite the carnage that has taken place in October
10/20/2025 Report (Click here to view)
Question of the Week: Where are our sights set now that the market has bounced, and panic has subsided?
Our Take on the Market
Macro Analysis

Metric Description:
Total Market Cap of top 250 assets today (excluding BTC, ETH, Stablecoins | line color: black)
200-Day Z-Score of the following calculation = Top 250 Assets Market Cap / Total Market Cap of BTC, ETH & Stablecoins
BTC, ETH and Stablecoins are viewed as potential flows into altcoins
Thus, this metric calculates the value of altcoins versus the amount of potential money that can flow into them
Values > 3: Crypto market is relatively heavy altcoins | time to take caution
Values < -2: Crypto market is relatively light on altcoin exposure | time to consider deploying into altcoins
Values > 0: Altcoins relative value trending upwards, vice versa for values < 0
Metric Takeaway:
Altcoins relative value is consolidating above zero, and possibly building a base for a leg up.
We find it particularly encouraging that this value held above zero after the swift market-wide drop on 10/10/2025. In our view, this signals potential market-wide strength.
The closest historical comparable is late 2023 when the BTC ETF got approved - the healthiest, sustained rally of this bull market for altcoins.
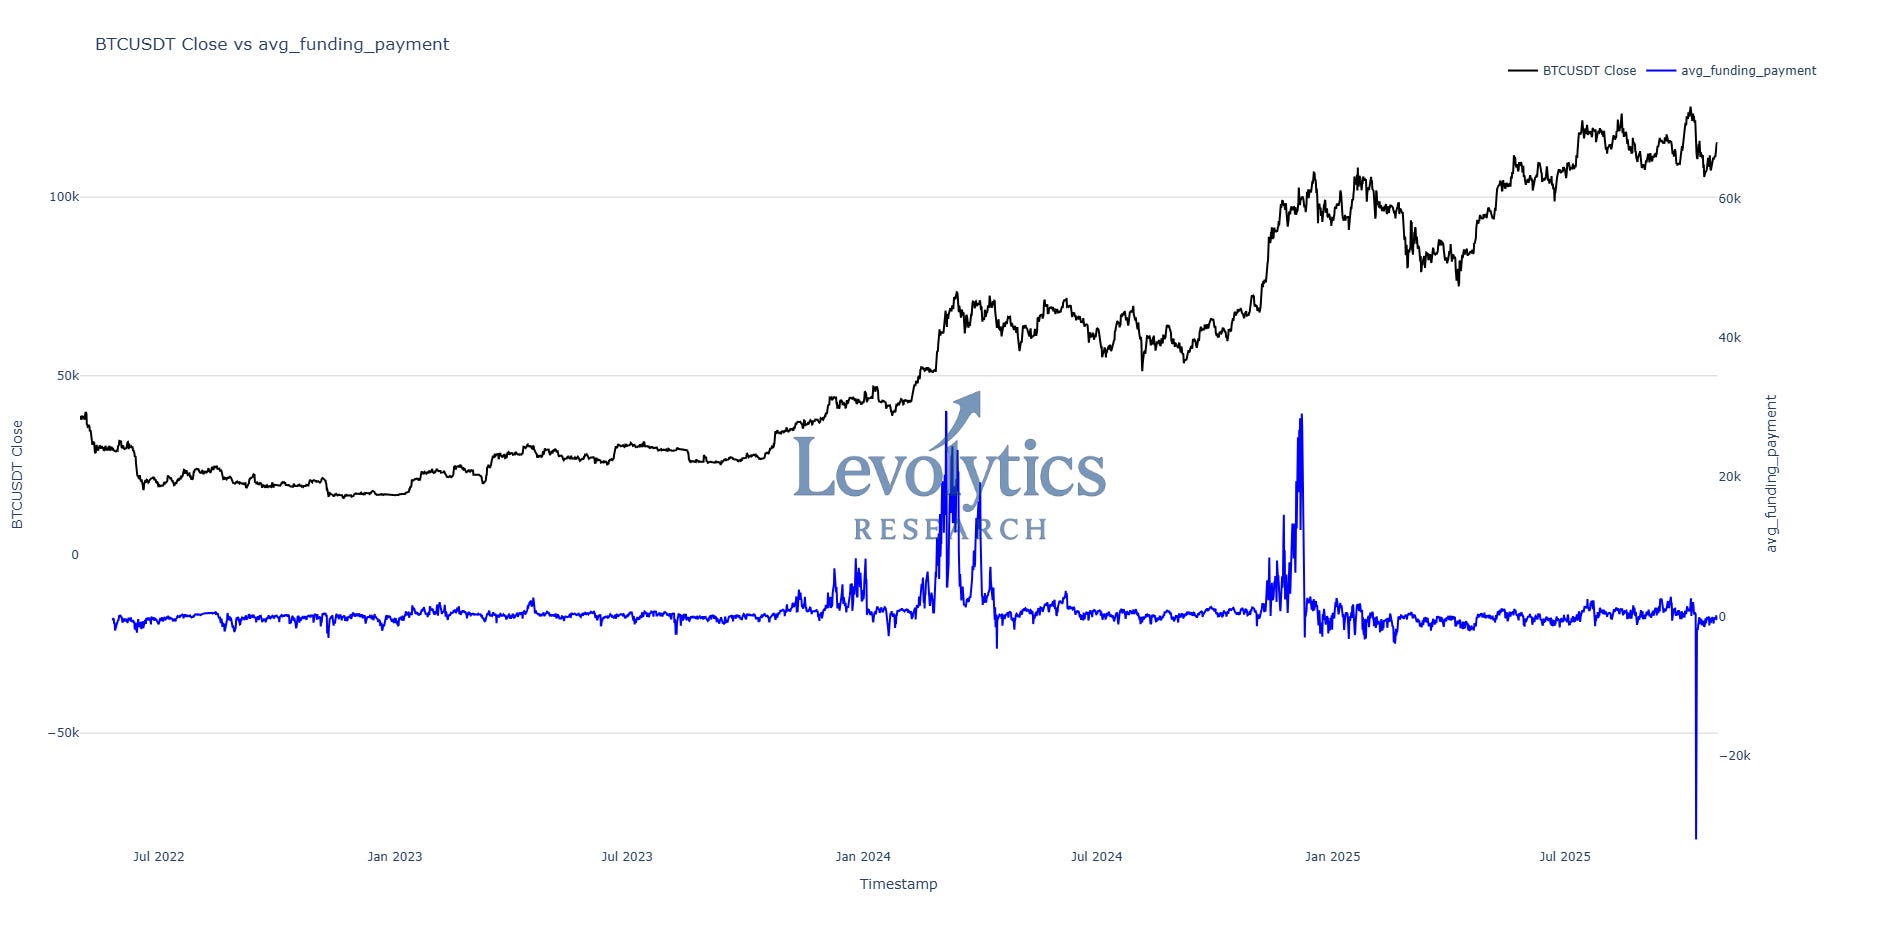
Metric Description:
Average periodic funding payment across all perpetual swap pairs on Bybit
Historical tops = $30,000+ per perpetual swap pair
Current value = $27
This metric takes into account open interest and funding rates, which provides a holistic view of the perpetual swaps market
Metric Takeaway:
The purpose of including this metric is to remind readers to zoom out if there is a range break out to the upside. If the $ value of funding payments remains low, that signals that both open interest and funding rates are low across the board.
After long periods of difficult price action, traders have a tendency to want to book profits early to make up for the losses they took prior to the range break.
In this case, the market’s positioning is telling us that people aren’t overly levered in preparation for upside. This could create conditions that are once again similar to the late-2023 crypto market pump.
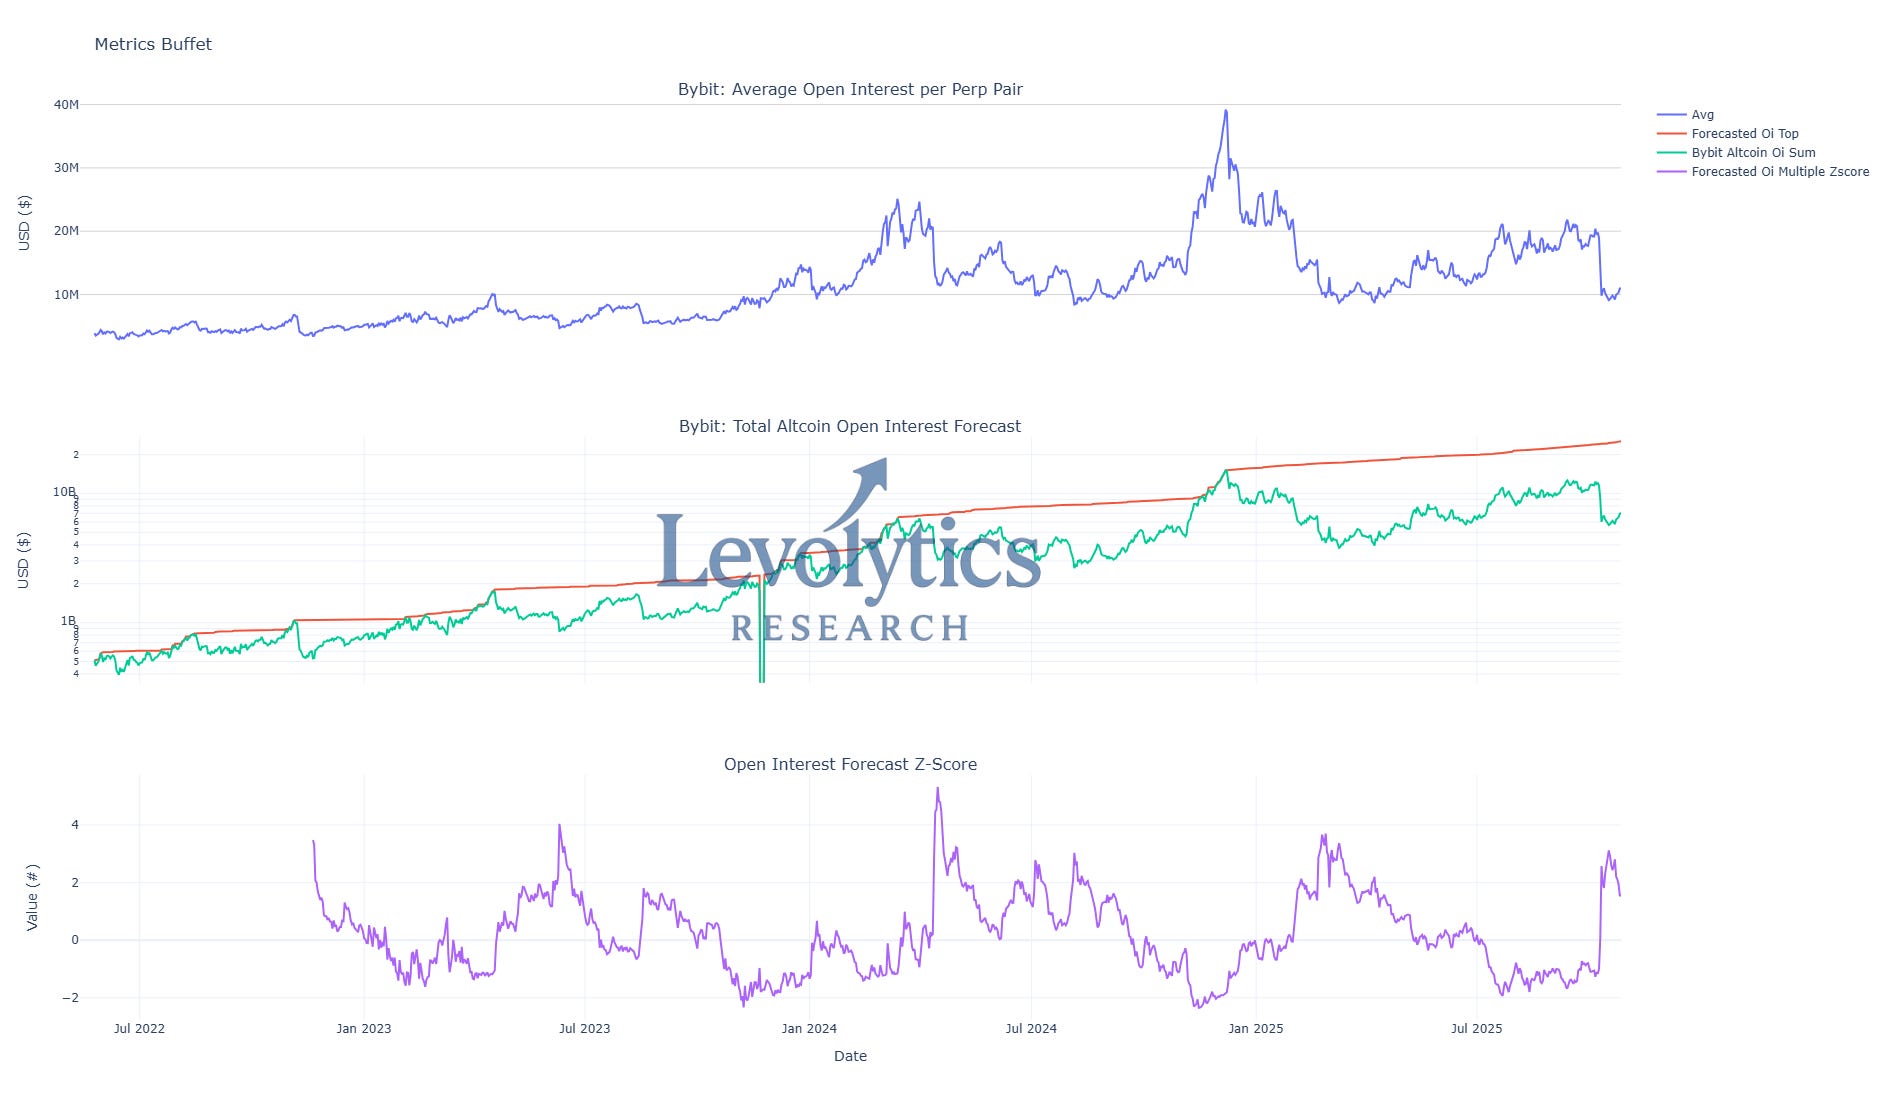
Metric Description:
Subplot 1: The average open interest per perpetual swap pair on Bybit
Largest value = $39 Million
Current value = $11 Million
Subplot 2: Total Altcoin Open Interest (green) vs Forecasted Open Interested (red)
Forecasted Open Interest = Rolling maximum value of average open interest per perpetual swap pair (i.e. subplot 1) * Rolling value of total perpetual swap pairs listed on Bybit
Current Forecasted Open Interest = ~$25 Billion
Current Total Altcoin Open Interest = ~$7 Billion
Subplot 3: Open Interest Forecast Z-Score
180-Day Z-Score of the following calculation = Total Altcoin Open Interest / Forecasted Open Interest
Demonstrates how leverage liquidity cycles work in crypto: shows how the $ growth of altcoin open interest tracks with the growth in number of pairs offered for trading
In theory, altcoin open interest should increase as more pairs are offered, especially as prices trend upwards
High values = Beginning of liquidity cycle = Relatively low leverage in crypto
Open interest lagging the growth in new pairs offered
Low values = Late liquidity cycle = Relatively high leverage in crypto
Open interest outpacing the growth of new pairs offered
Values below zero tend to last for 3-6 months during bullish impulses
Average duration between values reaching greater than 3 is 8-10 months
Current value = 1.52 = early liquidity cycle
Bottomed at 3.11 on 10/10/2025
Metric Takeaway:
Subplots 1 and 2 show how we land on subplot 3, which is the focus here.
Large drawdowns in market-wide leverage do not occur from liquidity that has built up over a matter of days or weeks. This liquidity is built up over MONTHS. The drawdown that took place on 10/10/2025 took liquidity that had built up from late February 2025.
A full 8 months of liquidity buildup wiped in a single week is horrifying while it’s happening, but afterwards it gives this market a possibly extremely bullish set up.
We have reset to early leverage liquidity cycle conditions, while also having the combination of BTCUSD only 10% from all-time highs, and the total altcoin market cap sitting close to the highs as well.
There’s a very real opportunity for an extended rally here.
Our Approach
Takeaway
The analysis above highlighted the following:
Altcoin market cap is holding value versus BTC, ETH, & Stablecoins
Funding payments for perpetual swaps remain completely flat, signaling neither open interest or funding rates have an overly bullish tilt
Open interest forecast signaling that we are likely early in a leverage liquidity cycle
Allocation Strategy: We believe it is justified to maintain a bullish bias while Bitcoin sits above $113,500 on lower timeframes, and $108,000 on higher timeframes.
We also believe owning altcoins that are exhibiting strength is justifiable if BTCUSD continues to hold the $113,500 level.
Macro Approach

Sweeping and subsequently bouncing off of the range lows following a large liquidation and a spike in volatility was encouraging to see. We still believe the line to hold is $108,000 on the daily chart.
Micro Approach
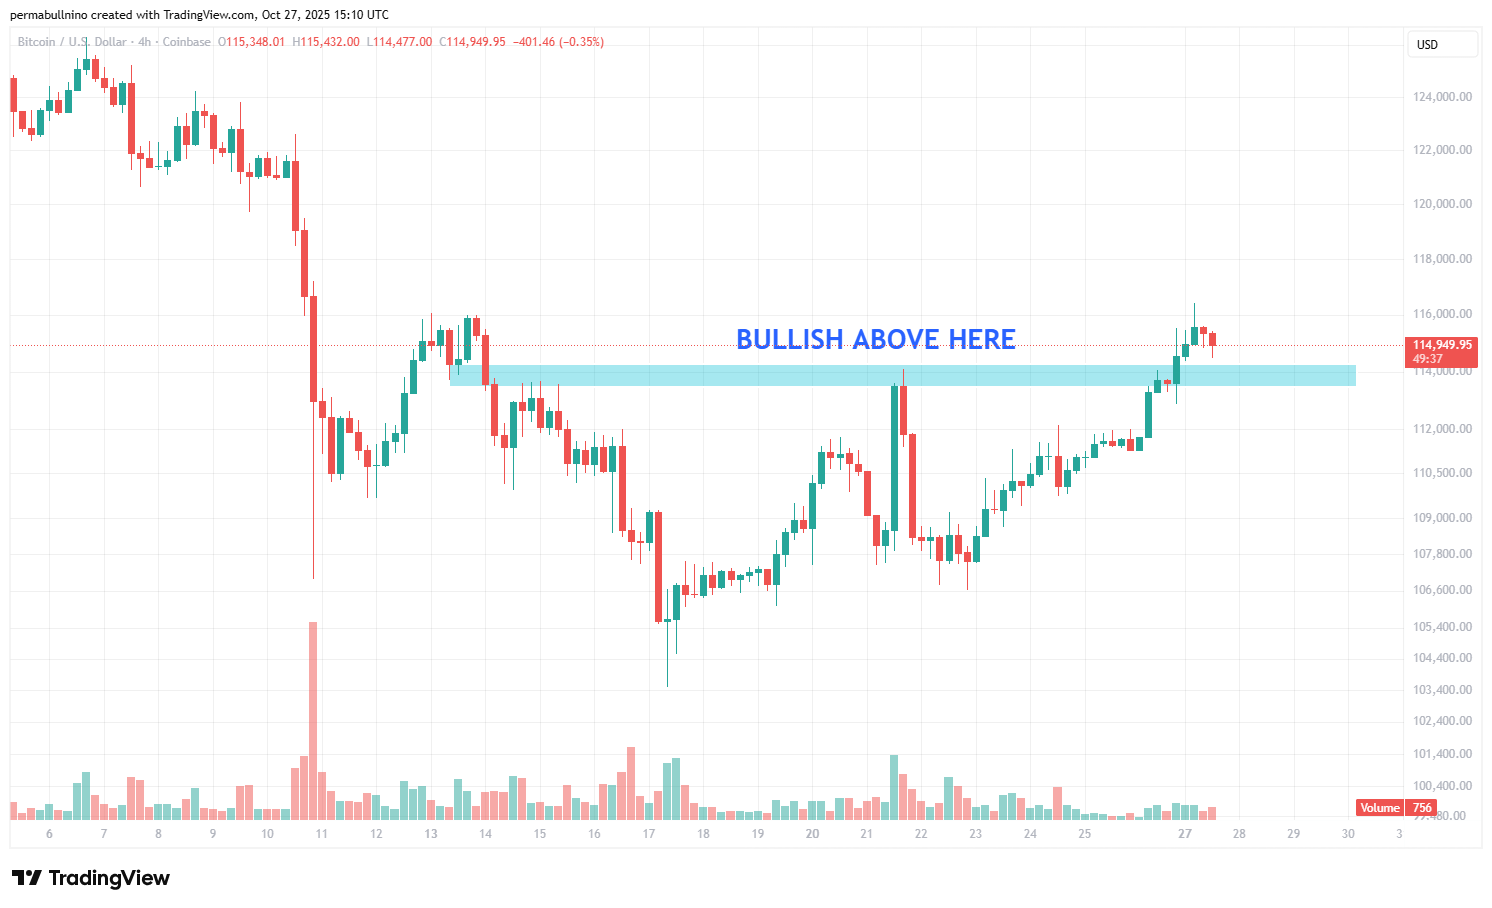
Our view on the lower timeframes is that we want to see BTCUSD hold this box between $113,500 and $114,200 if we are to see continued upside for the rest of the market. A break below this level will put us back into a defensive mindset with our capital.

The VIRTUAL break out that took place over the weekend is an example of a clean trade set up:
After liquidation, price goes sideways
Price breaks above range with volume
As a trader, if you had a bullish bias (there have been reasons to be constructive | discussed in previous Levolytics publications) the theory is “price should continue to go up on the break of the range to the upside”
Price “levotates” (see what we did there) 50%+ and leaves the range in the dust
Summary: Analysis helps build a bias. If price begins to confirm your bias, it would be unreasonable to not take action
Strategy
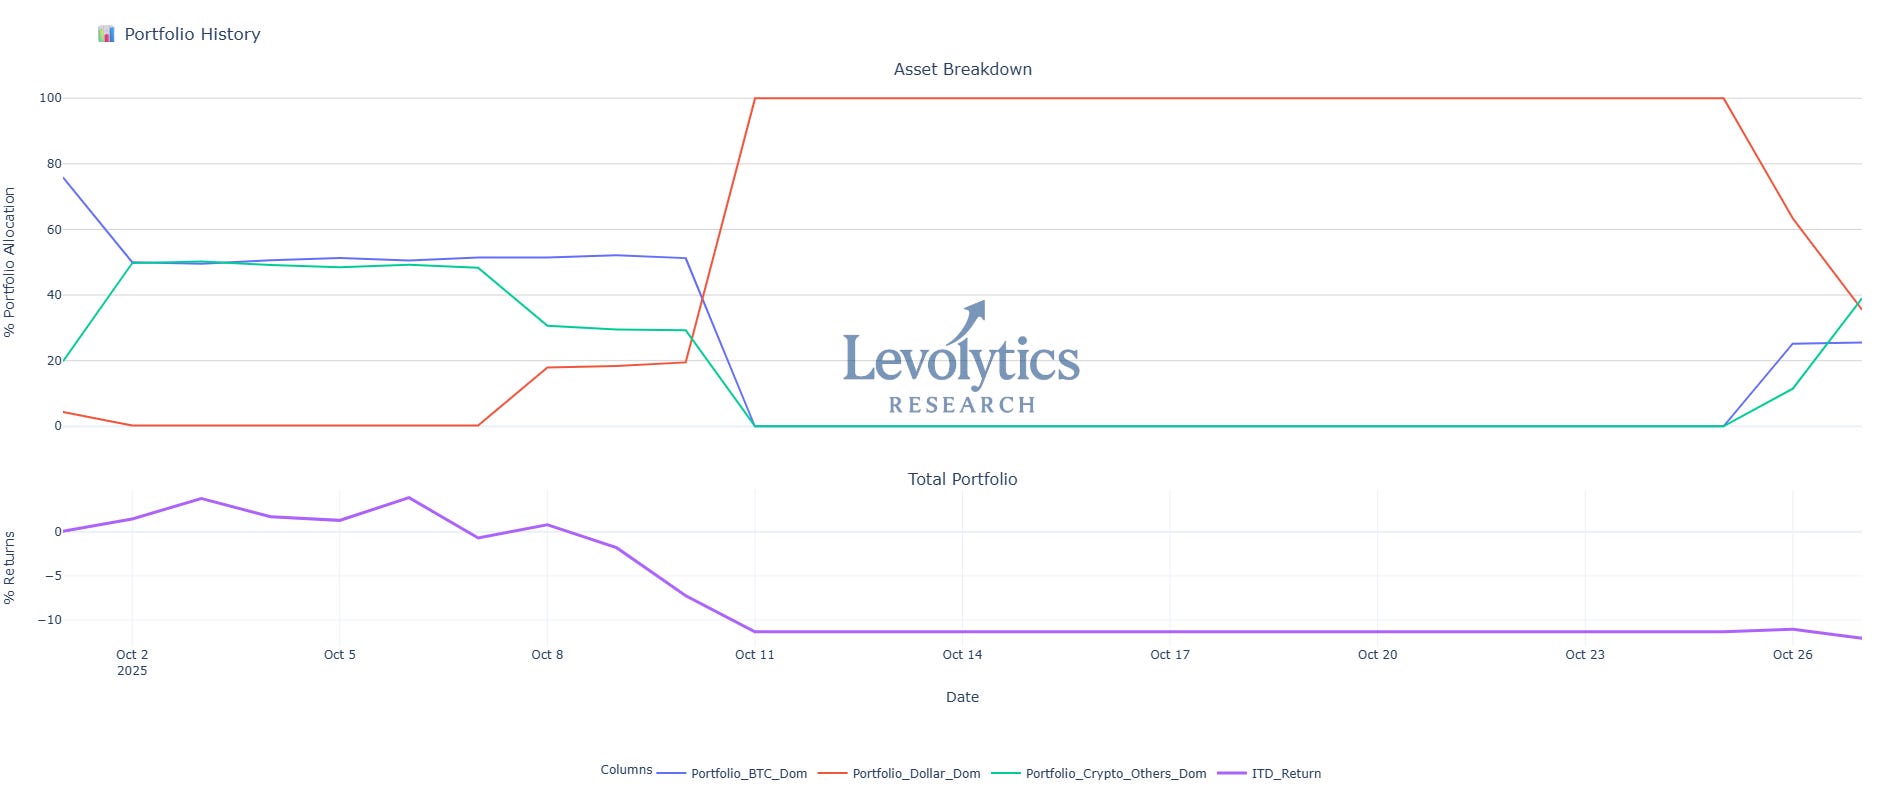
Our current portfolio composition is as follows:
% of Portfolio in BTC = Blue line
Current value: 25.51%
% of Portfolio in Crypto Alts = Green Line
Current Value = 38.96%
Includes ETH holdings
% of Portfolio in Cash = Orange line
Current value: 35.54%
Inception to Date Returns = Purple line
Current value: -12.08%
Note: Levolytics Research liquid strategy went live October 1, 2025.
Explanation: Long triggers have kicked in for various assets and we are in the process of deploying. Sell triggers will likely kick in across the portfolio if BTCUSD convincingly closes below $113,500.
Sign Off
We have the combination of early leverage liquidity cycle conditions + positive momentum in altcoins versus flow assets
These conditions follow a high volatility sweep of BTCUSD range lows
BTCUSD is challenging lower timeframe range highs, we are looking to see price hold above $113,500
Levolytics strategy is around 65% deployed, and cautiously adding as we gain confidence that the market is ready to lift
We remain convicted that there’s possibly substantial upside if BTCUSD can move back above $120,000
Until next time,
Disclaimer
The performance results presented herein reflect proprietary trading activity conducted with internal capital only. No external capital is managed, accepted, or solicited. These results are unaudited and are provided solely for informational and research purposes.
Performance data represents the return on internal capital based on realized and unrealized gains and losses, net of trading fees and transaction costs, but before any taxes or potential operating expenses. The methodology used to calculate performance has been applied consistently; however, results have not been verified by any independent party.
Past performance is not necessarily indicative of future results. All investments involve risk, including the potential loss of principal. The information contained herein does not constitute an offer to sell or a solicitation of an offer to buy any security, investment fund interest, or other financial instrument.
Any opinions, estimates, or forward-looking statements are subject to change without notice and are provided for illustrative or educational purposes only.