
Levolytics Research #17: Tick Tock Range Traders
Edition #17 | Website Update

Welcome to the newest edition of Levolytics Research! The home of actionable data. If you enjoy the research, please subscribe and share our work with friends and colleagues, and follow @levolytics + @permabullnino on X, the Everything App.
Website Update
We are wrapping up our website design this week and will be troubleshooting shortly thereafter. Subsequently, the launch will be as follows:
Sign ups will be managed through the Substack platform
Current paid subscribers will receive access first
In the future, the website will have its own sign up flow separate from the newsletter
Website will have a few surprises for users, more on that when we get closer to launch…
Our Take on the Market
Crypto crab market reigns king. Bitcoin moving sideways, and altcoins continue to chop traders to death. At Levolytics, we continue to sharpen our market tooling for what may come next.
Below, we will continue to build the case for a crypto rebound. We will start with a few time-based tools to kick off a dive into further explaining how we believe we are in the very late innings of the crypto winter.
Let’s begin!
Macro Analysis
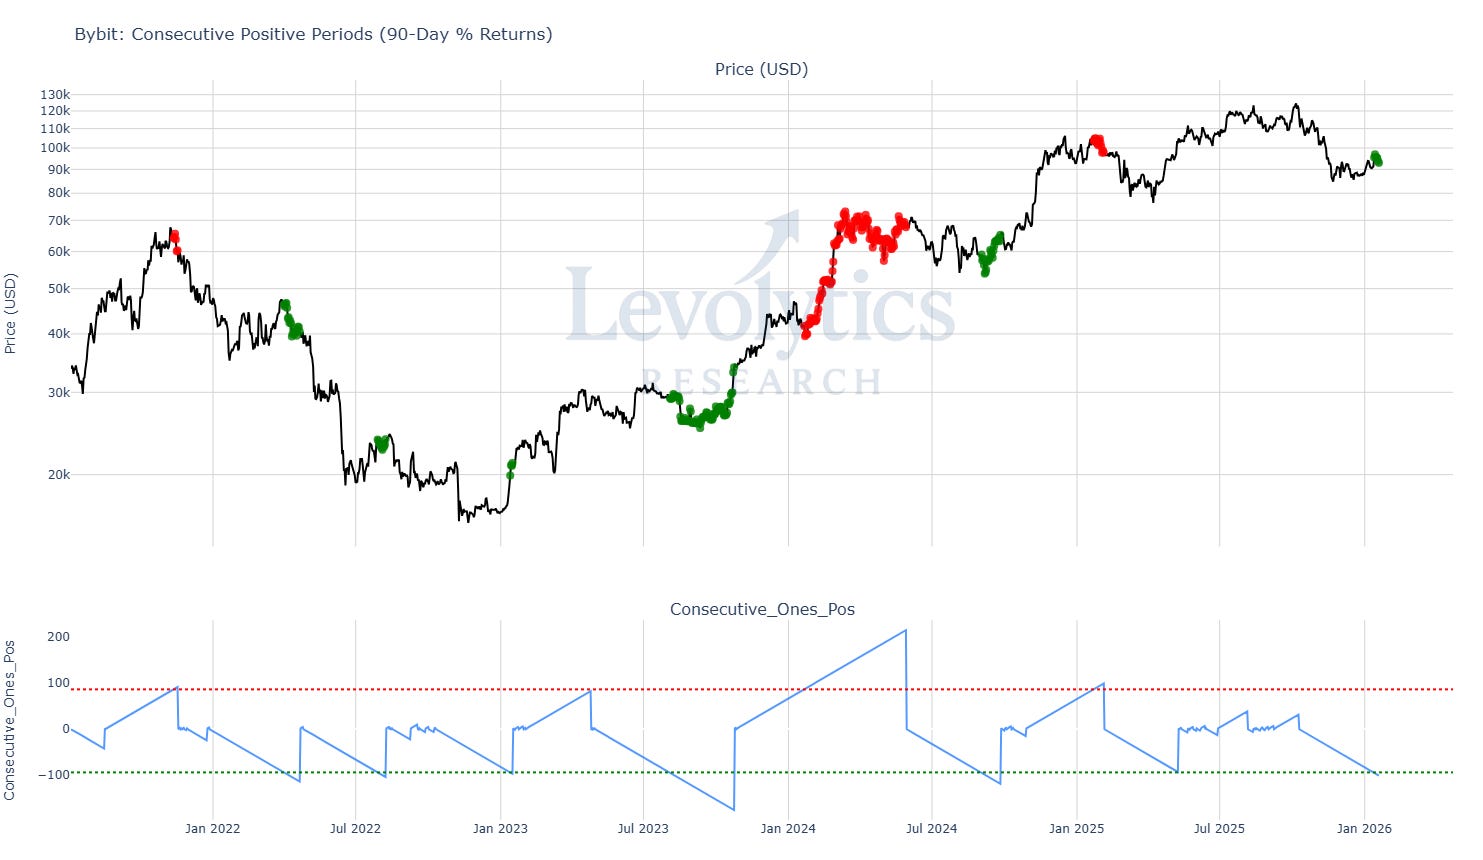
Metric: Consecutive Days of Positive or Negative Average 90-Day % Returns for All Perp Pairs on Bybit
Current value = 102 consecutive days of negative 90-day % returns
Positive values = Consecutive days of positive returns
Negative values = Consecutive days of negative returns
Green dots = Smallest 150 values in data set
Currently = 95 days in a row of negative returns or more
Started printing green dots on January 13th
Red dots = Largest 150 values in data set
Currently = 86 days in a row of positive returns or more
Previous 2 periods of deep negative values:
September 2024 (Right before US Presidential Election)
October 2023 (Run up into BTC ETFs launch)
Metric Takeaway:
