
Levolytics Research #14: Expectations for Beginning of 2026
First Chart Free | Edition #14

Introduction
Welcome to the newest edition of Levolytics Research! The home of actionable data. If you enjoy the research, please subscribe and share our work with friends and colleagues, and follow @levolytics + @permabullnino on X, the Everything App.
Special Notes
The Levolytics team is hard at work on getting our charting website up and running for our paid subscribers
Projected launch: January 2026
This will be our only report this week, next week we return back to regular programming
Our Take on the Market
Macro Analysis
Metric Description:
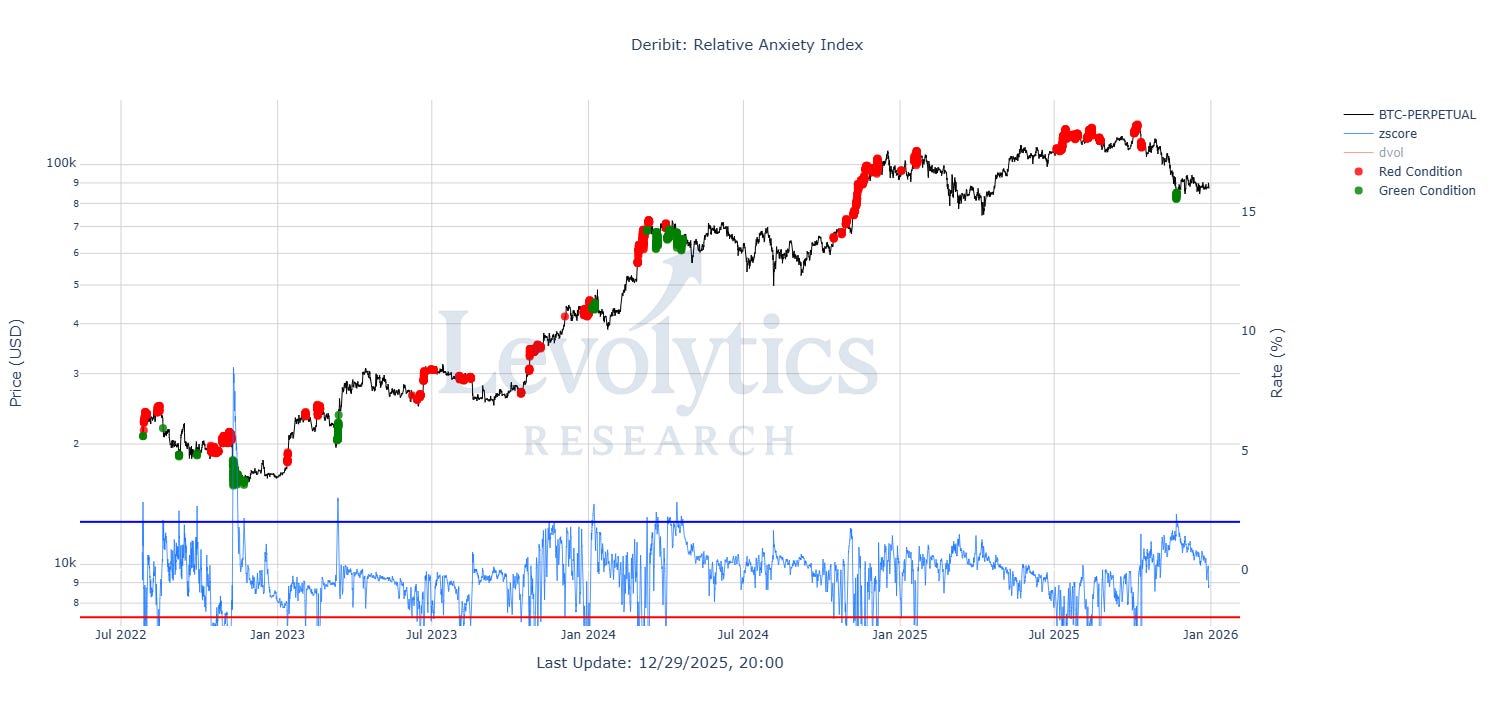
Metric: BTCUSD vs Relative Anxiety Index
Relative Anxiety Index (Blue line) = 200-Day Z-Score of DVOL Minus BTC-PERPETUAL Annualized Funding Rate on Deribit
DVOL = 30 day (forward-looking) annualized expectation of volatility
Red dots = Funding rates are much higher than DVOL
Red dots = very high confidence in the market = values < -2
These generally occur during strong trending conditions or market tops
Green dots = DVOL is much higher than funding rates
Green dots = very high levels of anxiety in the market = values > +2
Most recent green dot = November 21st, 2025
These generally occur during large liquidation events / market bottoms
Current value = -0.77
Note: DVOL & Annualized Funding Rates do not need to be equal. This metric measures the trend and large dislocations from the historical trend.
Metric Takeaway:
