
Levolytics Research #13: Some Musings on Crypto Becoming the Worst Casino
Available to All Subscribers | Edition #13

Introduction
Welcome to the newest edition of Levolytics Research! The home of actionable data. If you enjoy the research, please subscribe and share our work with friends and colleagues, and follow @levolytics + @permabullnino on X, the Everything App.
Market Update
Bitcoin, and the crypto market in general, remains range bound, with choppy and volatile trading conditions
Traders continue to check out for 2025, with the ramp up for 2026 just around the corner
Our Take on the Market
Macro Analysis
2025 is nearing a close, and with that we have another year of the crypto markets to reflect on. A lot has changed over the years, so we wanted to take an opportunity to do a deep dive on the current state of the market from an angle that we found most interesting / relevant. And no - we are not going to be discussing the effects of quantum computing on Bitcoin.
This week we are going to do a deeper dive on the state of assets that trade on Coinbase, crypto’s premier exchange from a branding perspective. Before we begin - we would like to acknowledge that we’re not sure where this rabbit hole is going to lead, but would like to give a few reasons explaining why we believe this is a worthwhile endeavor:
Coinbase has a history of trust - no exploits or fraud, and is now an audited + publicly traded company
Coinbase has a history of being more selective than other exchanges as it relates to adding support for new trading pairs
Coinbase is a popular venue for trading, with $295 Billion in trading volume in Q3 2025
Majority of this volume is from Americans
The above is mentioned to establish: Coinbase, their assets listed, and their respective performances over time is a fair representation of the crypto markets at large. This is by no means meant to pick on Coinbase either, just so we are clear early on.
Metric Description:
Metric Description:
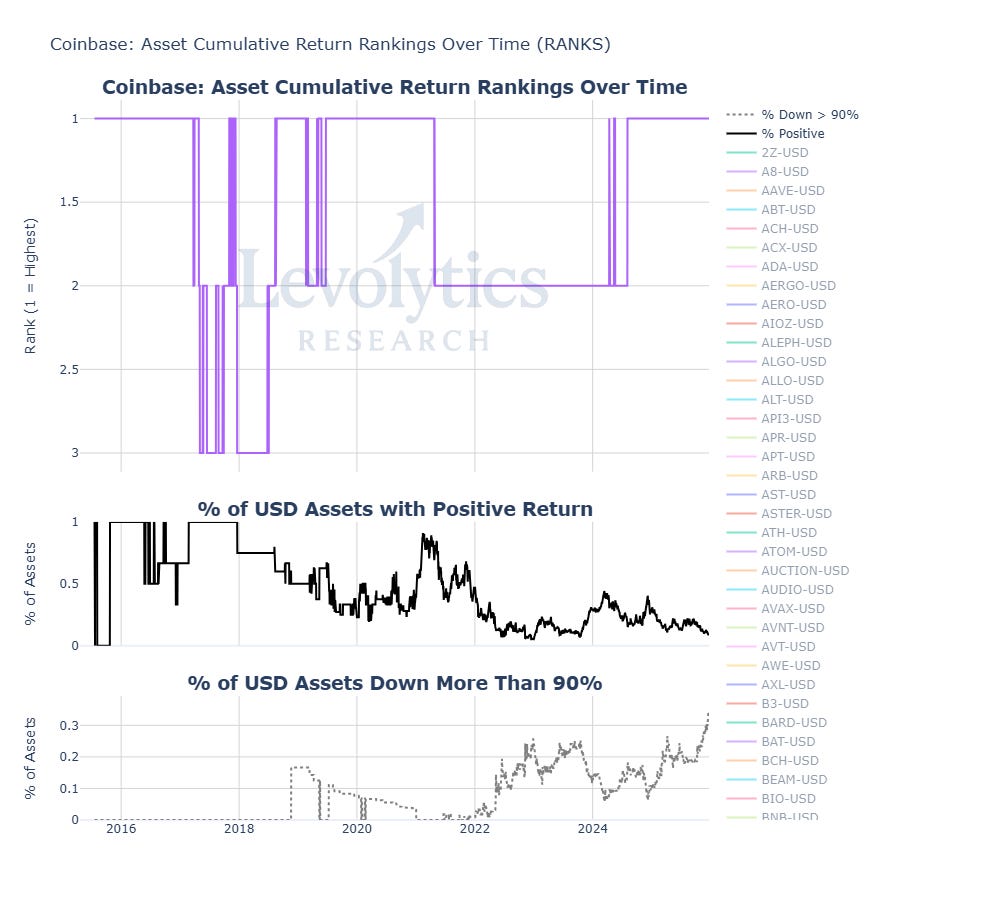
Metric 1: BTC-USD Cumulative % Returns Rank (Since Added to Coinbase)
Bitcoin has spent almost its entire history as the top performing asset on Coinbase, and thus ranked #1
The 2017-2018 bull market brought a brief period where it plunged to #3
Metric 2: % of USD Assets with Positive Return (Since Added to Coinbase)
Current value = 10%
There are approximately 350 USD trading pairs on Coinbase, this means ~315 of them have a negative return since being added to the platform as a tradeable asset
Metric 3: % of USD Assets Down More Than 90% (Since Added to Coinbase)
Current value = 32%
There are approximately 350 USD trading pairs on Coinbase, this means ~110 of them are down more than 90%
Highest value this metric has ever printed
Metric Takeaway:
This chart is included to set the stage for our analysis:
BTC-USD is the best performing asset on Coinbase (added in 2015) - ETH-USD & LTC-USD are the only 2 assets to ever surpass it
Almost every single asset on Coinbase has a negative return - people talk about crypto being “the worst casino” these days, and this metric really hits that home. 3/10 might get you into the hall of fame in baseball, but 9/10 is abysmal for pretty much anyone’s standards.
The intensity of the losses are also significant: 32% of assets traded on the platform are down 90% or more. This figure likely plays a large role in current sentiment for the average crypto market participant: unless they stayed all-in on BTC, there is a fairly high probability that they are holding onto something that is down a crippling amount. Back in the day we called this “becoming a community member”. Welcome to Hades, brothers and sisters.
Metric Description:
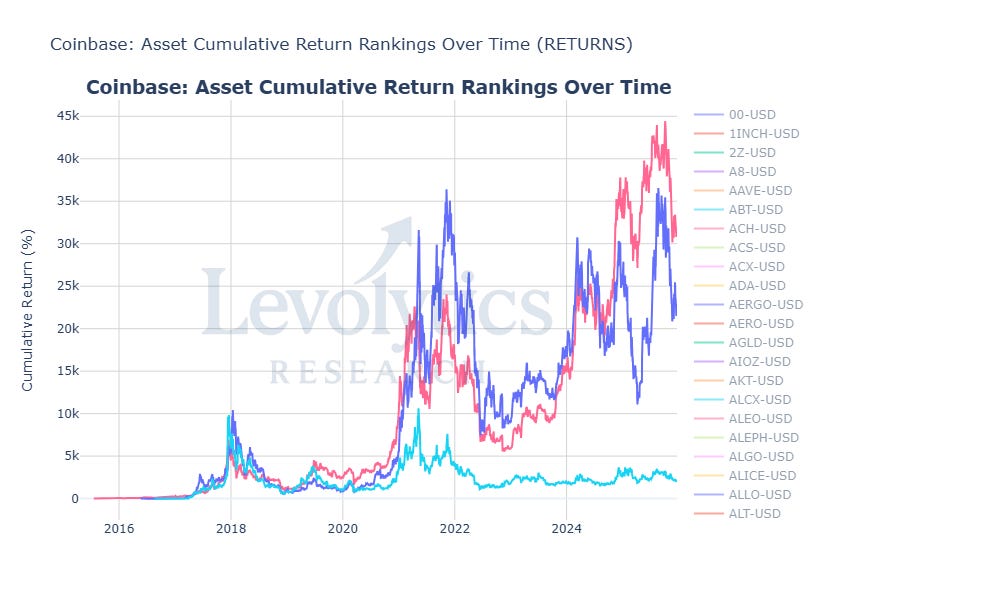
Metric: BTC-USD vs ETH-USD vs LTC-USD Cumulative % Returns (Since Added to Coinbase)
BTC-USD (Pink) = +31,000%
ETH-USD (Blue) = +23,000%
LTC-USD (Light Blue) = +2,100%
These are the top 3 performing assets on Coinbase if measuring by cumulative returns since added to the exchange
Metric Takeaway:
In the previous section, we mentioned how ETH-USD and LTC-USD are the only other 2 assets to challenge BTC’s hegemony as the top performing asset on Coinbase. We also included the factoid that they remain the other 2 top performing assets on Coinbase. This chart shows the following:
BTC & ETH are in leagues of their own performance wise, and the wealth effect they created in the crypto space were likely generational opportunities that will never be available again on a tier 1 crypto exchange.
If you had a Coinbase account when they launched, you owned these assets. Crypto was in easy mode, as there were very few assets to choose from on Coinbase up until the 2020 period.
The fact that the 3rd best performing asset, LTC, is an extremely distant 3rd tells you everything you need to know.
Metric Description:
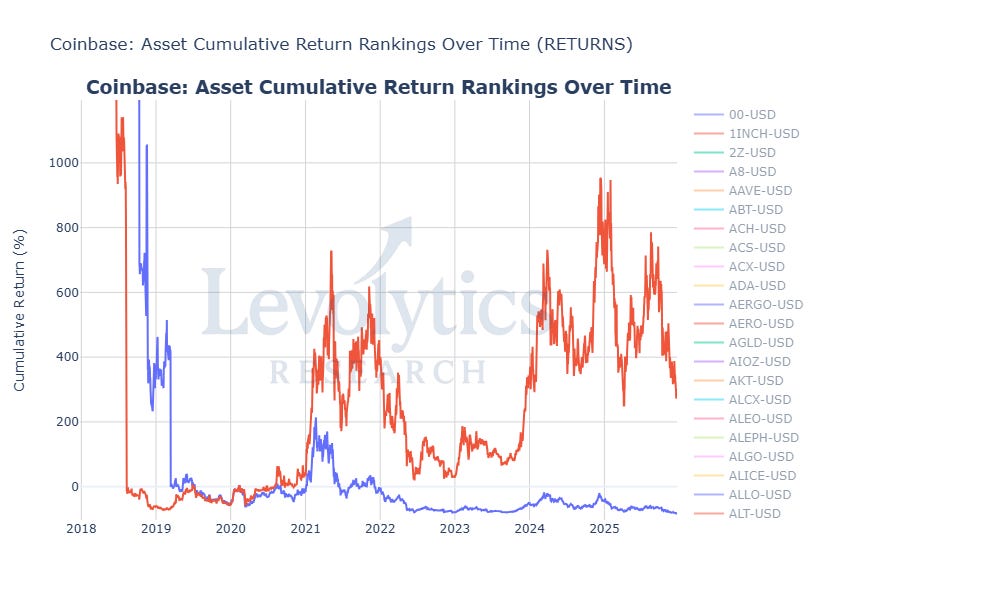
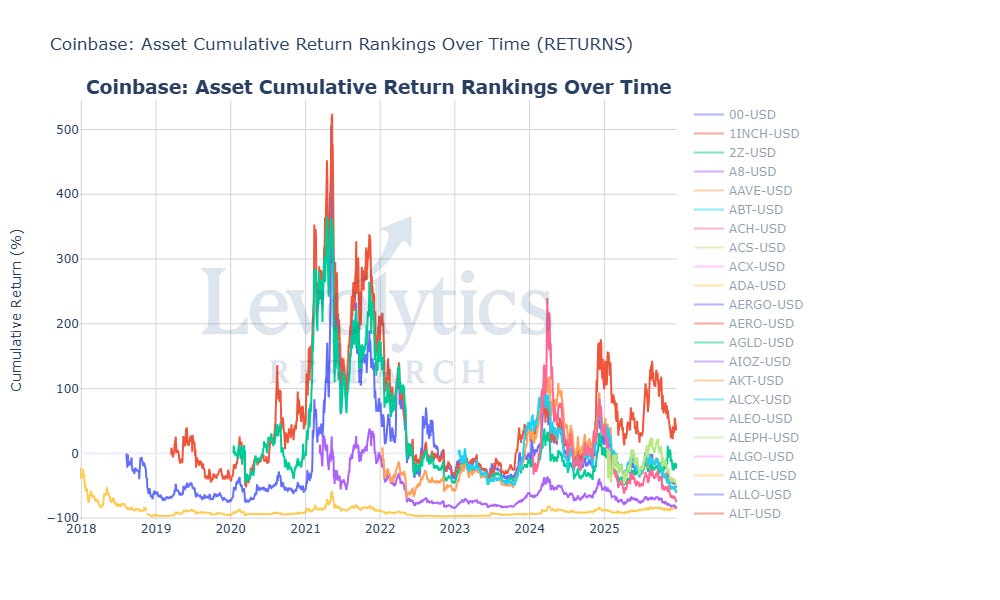
Metric: Median % Return of Top 10 Assets on Coinbase Excluding BTC + ETH (by Cumulative Return) vs Median % Return of All Assets on Coinbase
Top 10 = +281%
All Assets = -82%
Metric Takeaway:
Lets really hammer home how poorly everything outside of BTC & ETH has performed. The meat of assets listed on Coinbase (i.e. median) are down 82%, which is already a tough looking number. However, now we can assume that you played things perfectly and held the top 10 altcoins on Coinbase since their day 1 launch - and you’re only up a measly 281% after wearing a lot of crypto volatility.
The best case scenario of +281% versus a -82% drawdown isn’t an appealing risk/reward profile for traders / investors looking to move money into the space.
Metric Description:
Metric: Average Cumulative % Return for Assets Listed between 2017 - 2025
This was done to exclude BTC, ETH & LTC to get an idea of which years created the favorite assets to own on Coinbase
Top Year = Assets Added in 2019 = 40% Average Return Since Day 1 Coinbase Add
Every other year has a negative average % return across all assets added in that year
Metric Takeaway:
Each year represents different themes of crypto’s history. 2019 was somewhat of a forgotten year as it preceded DeFi summer, and there were only 6 newly listed assets on Coinbase that year. Otherwise, we believe the takeaway is that there have been no particular favorites.
Another time we will dig deeper into the particular standout assets within these cohorts.
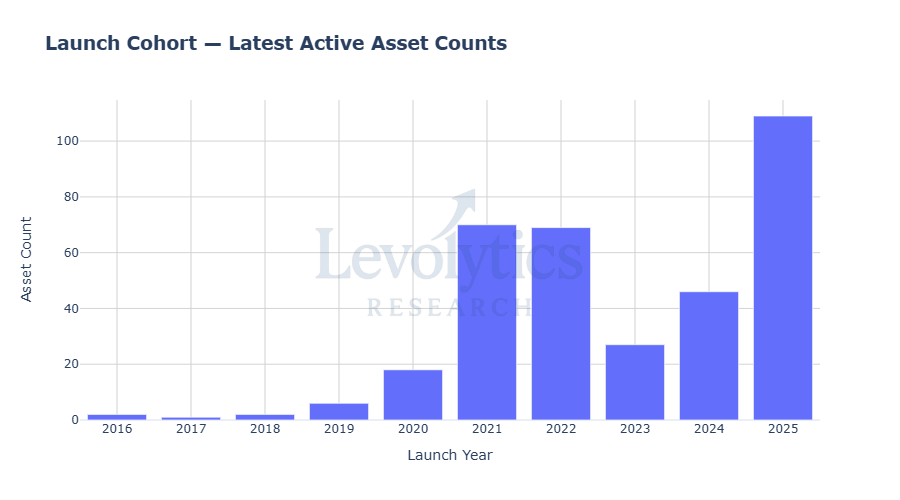
Metric Description:
Metric: Number of New Assets Added to Coinbase Each Year
Biggest Year = 2025 = 109 new assets
Acceleration in new asset support began in 2021 with 70 new USD pairs added
Metric Takeaway:
There is no doubt that the increase in token supply has created a great deal of stress on asset prices. Capital gets spread out, and with that so does attention. Ever been to a restaurant with a gigantic menu? It distorts and increases the difficulty in finding the good menu items (in this case, crypto assets) that are worthy of your money.
Another dynamic that is not lost on us is the huge spikes in listed assets that took place in 2021, 2022, 2025:
2021 + 2022 = Strike while the iron is hot, launch new tokens and get them added to Coinbase!
2025 = Trump is in office! Crypto bull market! Rejoice!
It’s not a secret that crypto markets have benefitted token sellers over token buyers for a very long time. This dynamic clearly kicked off in 2021, and it makes sense that the market hasn’t truly exited what we believe was the end of the 2021-2022 bear market.
The simple tell was this: Coinbase used to have an extremely limited selection of assets on the platform, to the point that people complained about it endlessly. Their change in tune was clear in 2021 (70 tokens added, pushing total assets listed from 30 to 100), which was the signal to all market participants that crypto had shifted from a token buyers to a token sellers market.
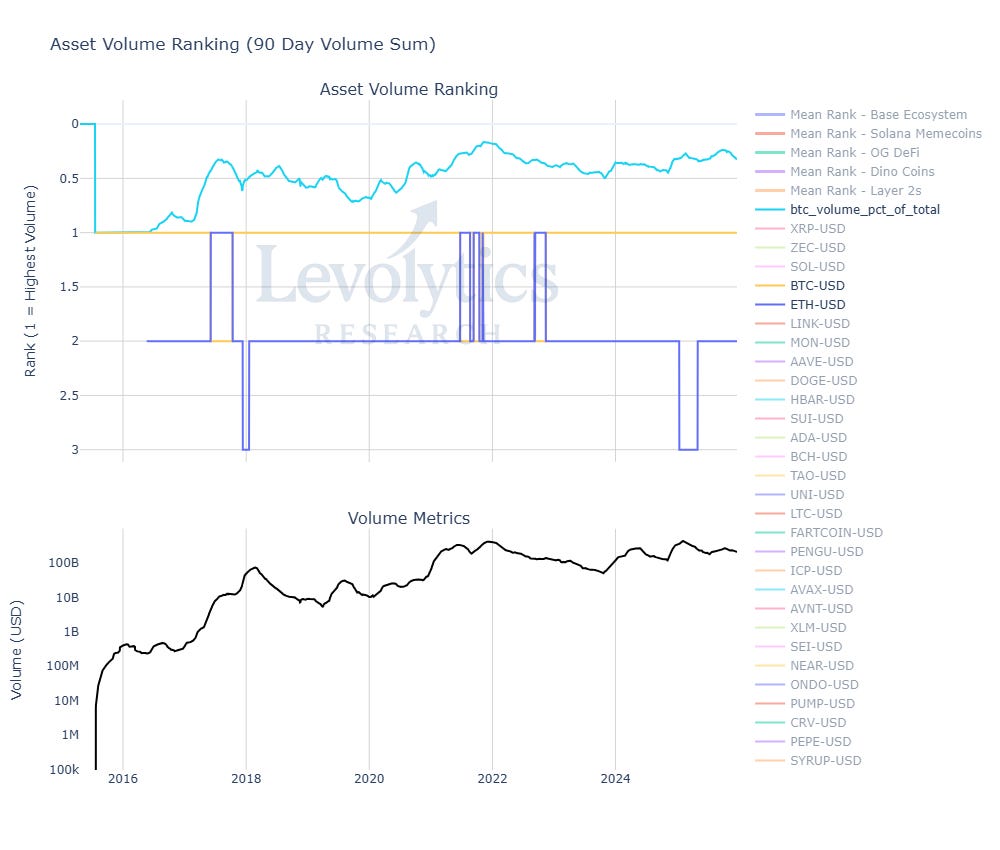
Metric Description:
Metric 1: BTC Total Volume Dominance (%)
Current value (Light Blue) = BTC is 32% of total spot USD pair Coinbase volume
Note: Y-Axis is inverted, so BTC Total Volume Dominance is down-trending as the years pass
Metric 2: BTC-USD vs ETH-USD 90-Day Volume Rank
BTC-USD (Yellow) = #1 asset in trading volume
ETH-USD (Blue) = #2 asset in trading volume
Historical tops have occurred when BTC gets flipped in volume, which has a strong signal for altcoin appetite (market tops on euphoria)
Metric 3: Total $ Volume for All USD Assets on Coinbase (Rolling 90-Day $ Volume)
Current value (Black) = $222 Billion
Trend = up and to the right
Highest value ever = $400 Billion
Metric Takeaway:
We are now moving onto the volume side of the equation. Why? Because volume indicates to us how interested people are in trading one asset over another, or if they care to trade this asset class at all. Our kick off will start describing what we believe the basics are as it relates to “interest in crypto”:
BTC remains the Batman of crypto, and ETH its Robin. Over the past decade they have established themselves as the #1 and #2 for trading volumes on the largest mostly-American trading venue (Coinbase) with very few breaks from their positioning.
BTC continues to lose share to altcoins in terms of total $ volume traded on Coinbase, which we believe is a function of the increase in net tradeable assets on the platform.
Crypto trading is in a stage of stagnation - Total Volume Traded has not made a proper new high since the market topped in 2021 - 2022. With an extended period of time of BTC trading above $100,000, this is a concerning figure.
Remember volume = interest, so this lines up with the poor performance we’ve seen in crypto over the past 4 years.
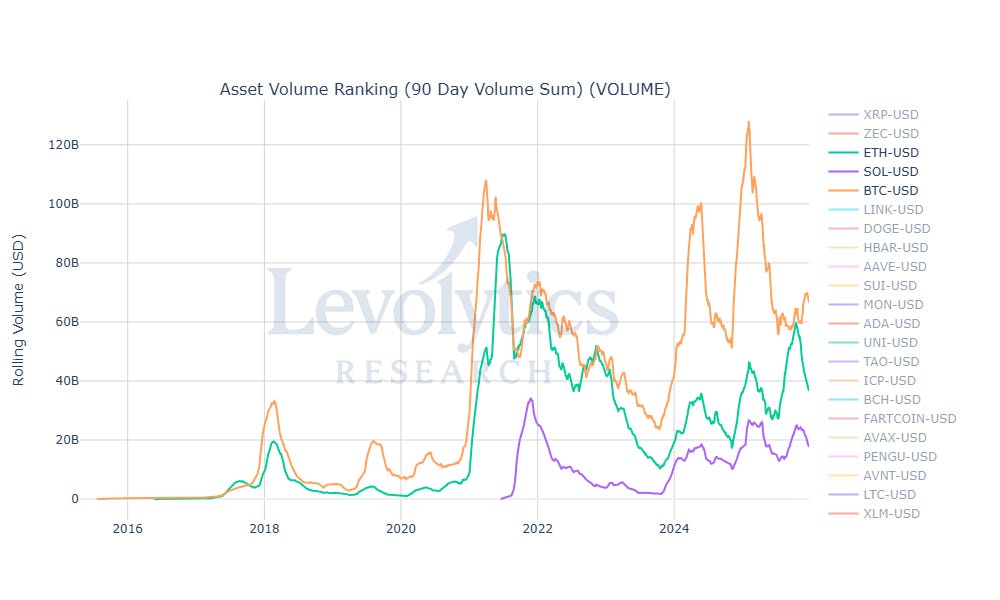
Metric Description:
Metric: BTC-USD vs ETH-USD vs SOL-USD 90-Day Volume
BTC-USD (Orange) = $68 Billion
ETH-USD (Green) = $38 Billion
SOL-USD (Purple) = $18 Billion
Ranked #3 in 90-Day Volume
Metric Takeaway:
Even the most popular assets for trading on Coinbase haven’t clipped proper new highs / interest in trading volume. After all the ETFs, DATs, new funds, everyone, still no new highs.
Is it possible volume went elsewhere? Definitely. However, our guts are telling us that this chart is more representative of the crypto apathy that has been present in the market, and only became more obvious after the market nose-dived in what was a year that was supposed to be very bullish for crypto.
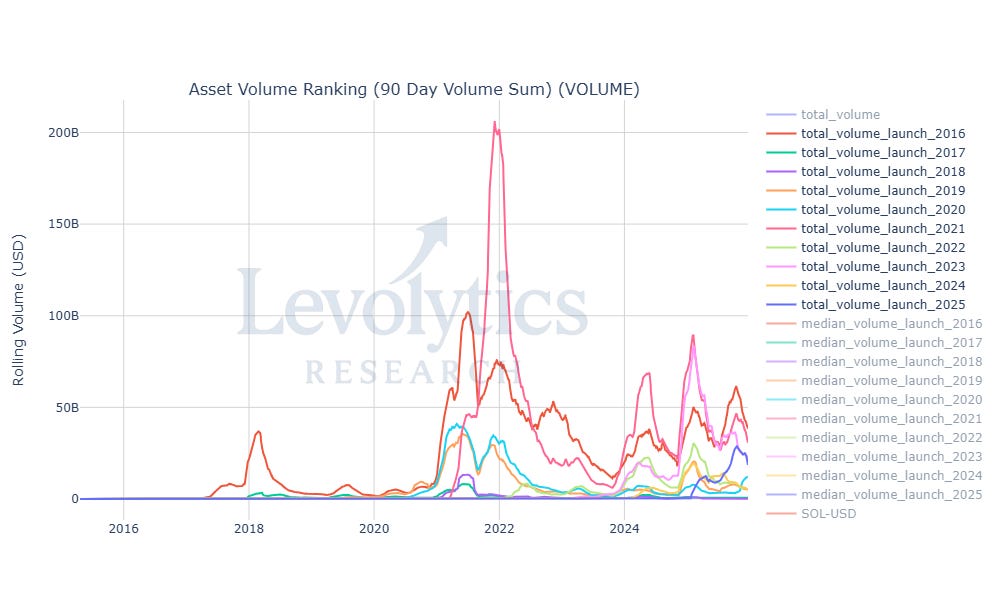
Metric Description:
Metric: Total 90-Day $ Volume for Assets Launched Between 2016 - 2025
2016 = Highest volume = $38 Billion
2019, 2022, 2024 = Lowest volume = ~$5 Billion
Metric Takeaway:
The 2016 cohort only includes ETH & LTC. These alone trade more volume than any other yearly cohort of crypto assets listed on Coinbase. 2021 is the only close second, which includes the likes of SOL, AVAX, etc. Remaining cohorts are punching way below their respective weights - with 30 - 100 assets listed, but at what is very clearly anemic volumes. We will cover this a little in next chart.
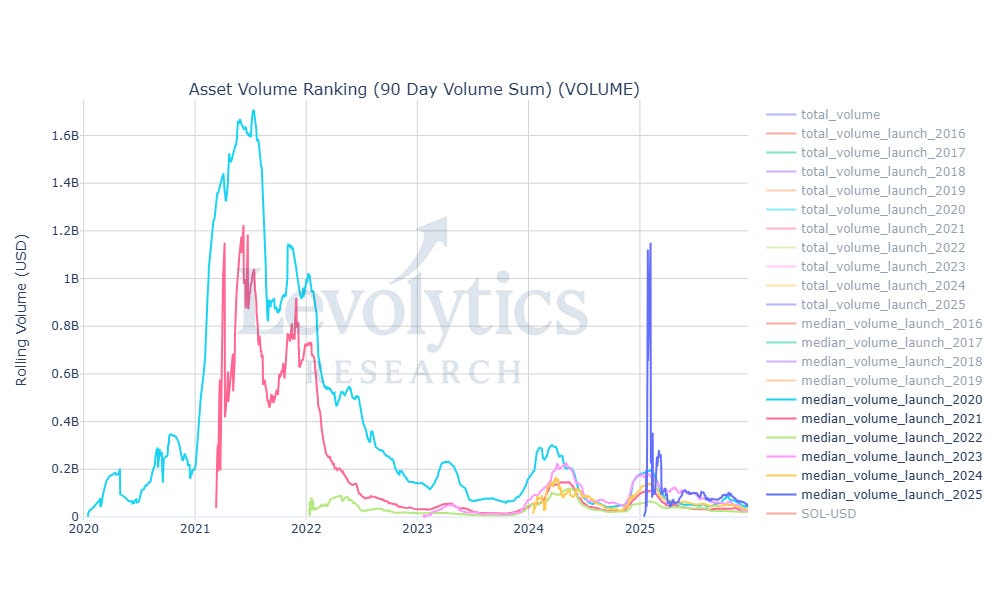
Metric Description:
Metric: Median 90-Day $ Volume for Assets Launched Between 2020 - 2025
Values range from $19 Million - $49 Million
This is $200,000 to $530,000 in daily volume
Metric Takeaway:
It’s pretty clear that there isn’t much of a standard being upheld here for daily trading volume, as the median pair for any yearly cohort is trading anemic amounts of volume. The crypto exchange business model can be described as:
Volume of assets offered is more important than the density of volume traded on any single asset. Now that compliance is no longer an issue, listing new assets has been green lit, and the flood gates have opened.
Note: Coinbase isn’t the only exchange doing this, we have Binance data that indicates similar approach has been taken (especially since CZ was pardoned).
Our Approach
Takeaway
The analysis above highlighted the following:
Crypto markets are not only down a lot, they are down a lot across A LOT of assets
Unless you held BTC or ETH, some portion of every person’s portfolio is likely down an irrecuperable amount
BTC & ETH were generational opportunities that will likely not be available on a tier 1 crypto exchange ever again
Since 2021, crypto has very clearly becomes a token sellers market:
People creating projects with a token get rich, not the purchasers of their token
Exchanges are adding new assets for trading at an unhealthy clip, with most assets on Coinbase trading with extremely little daily volume
The risk/reward has is very unfavorable for token holders over a long time horizon
These conditions have created an extremely predatory market i.e. one where investors / traders have a short term time preference
Crypto has rinsed everyone with delusions of grandeur. This is a trader’s market, and liquid market investors need to understand that under the current crypto market construction, they are betting against the casino by being long altcoins for years at a time.
If some VC or private market investor tells you otherwise, that is because they are the “token sellers” we have spoken of within. If it’s not them, it’s the teams of any of these projects.
It seems we are in an endless doom loop and it remains to be seen what will break crypto out of this chokehold.
In future weeks / months, our plan is to work on new tooling that will help us / our readers better understand when the “tide might be turning”. Until then, we read, write, and code.
Macro Approach
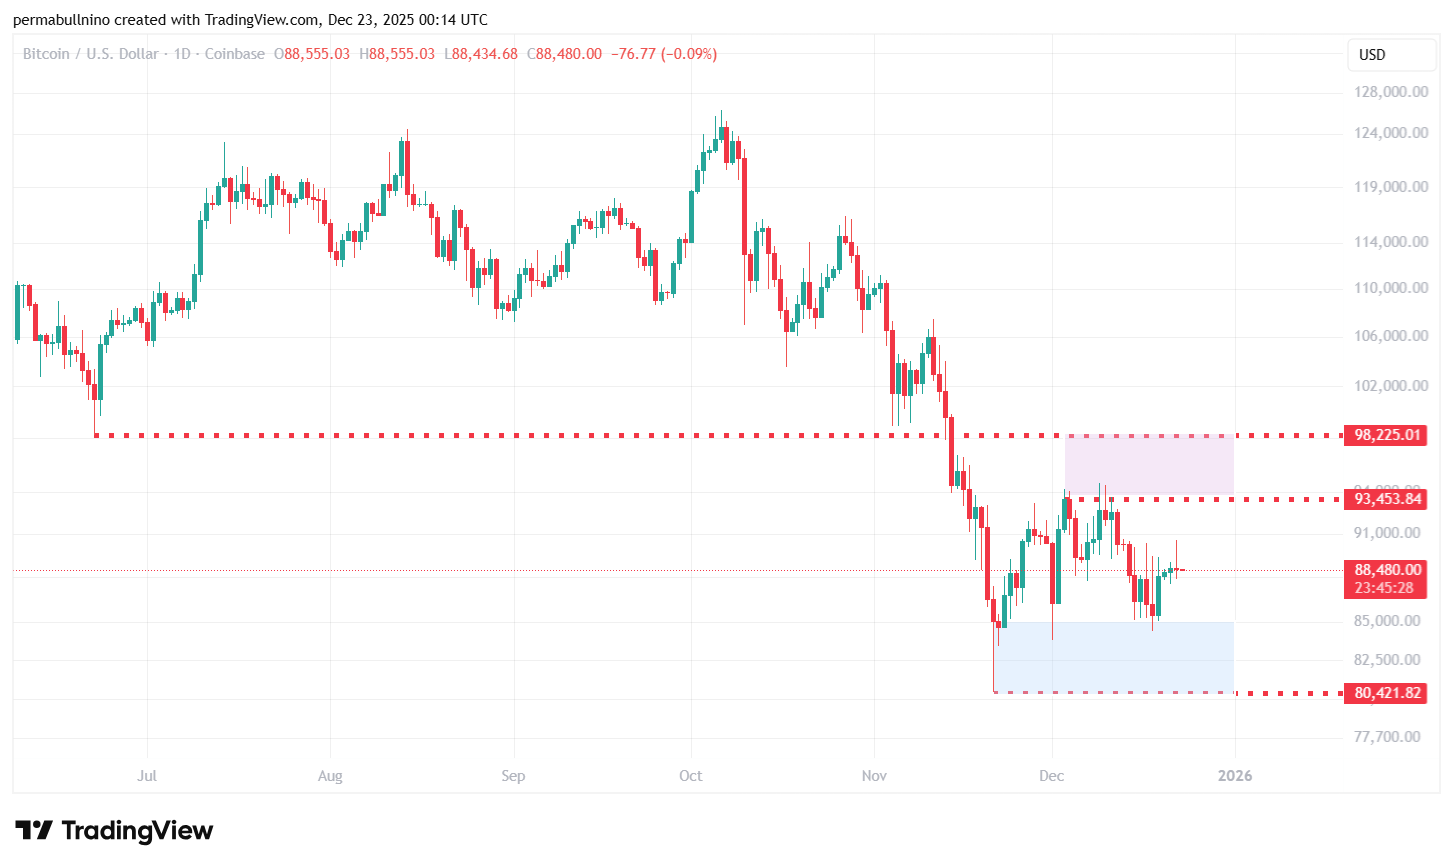
The BTCUSD price has barely moved since last week’s publication. As we said before - this is a trader’s market, so let them push the price around until something decisive happens. Dry powder might come in handy in the new year.
Strategy
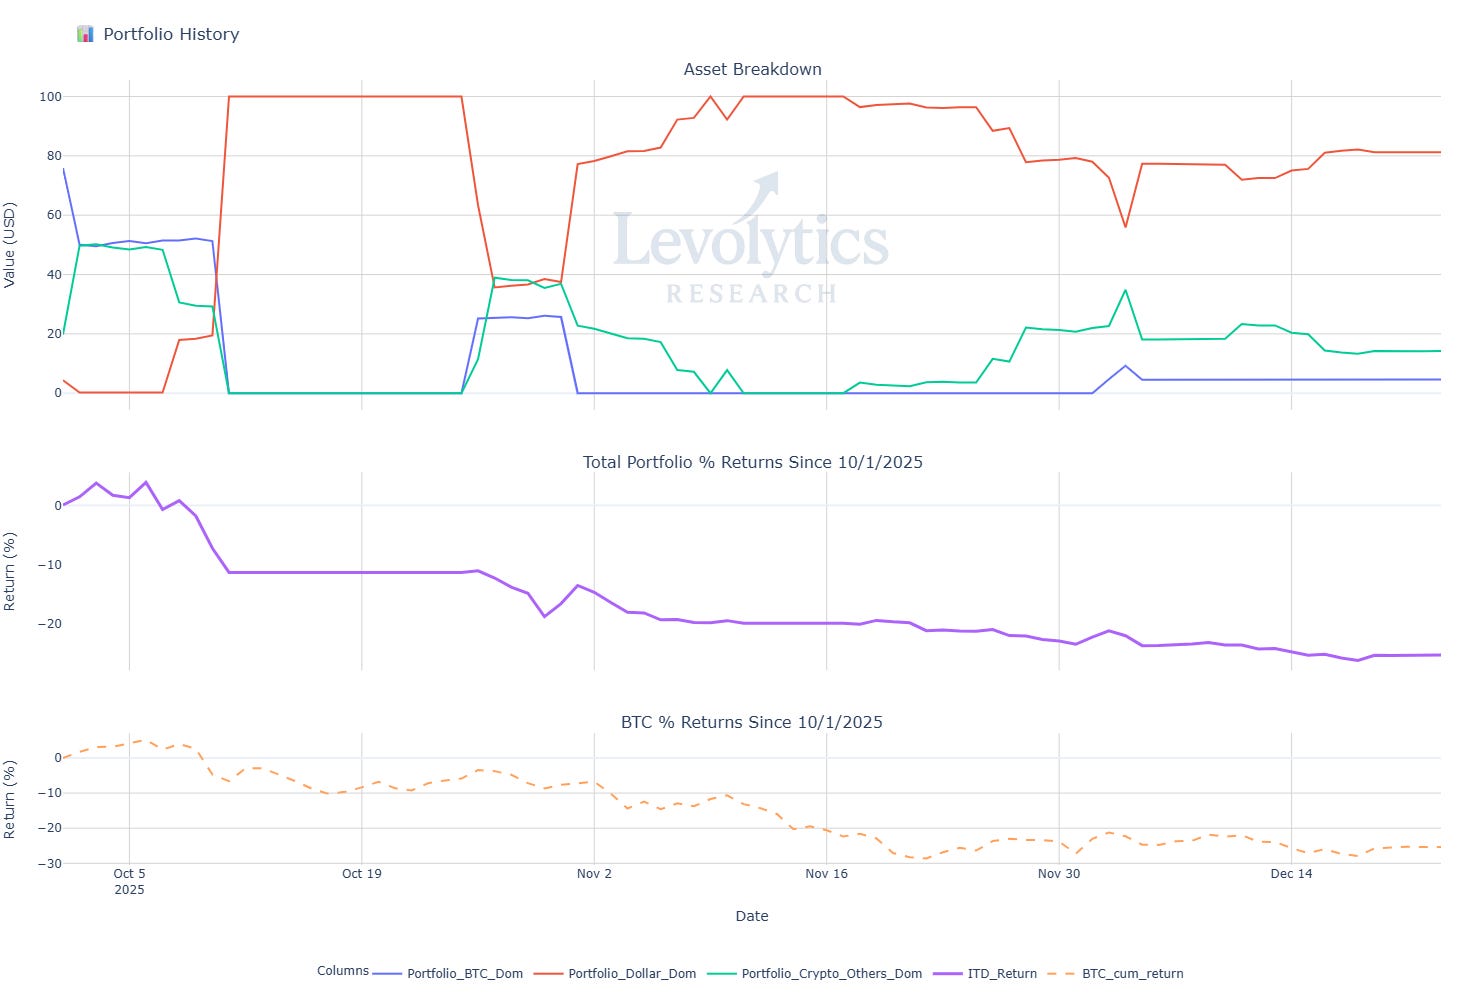
Our current portfolio composition is as follows:
% of Portfolio in BTC = Blue line
Current value: 4.63%
% of Portfolio in Crypto Alts = Green Line
Current Value: 14.19%
% of Portfolio in Cash = Orange line
Current value: 81.18%
Inception to Date Returns = Purple line
Current value: -25.35%
BTC Returns Since Inception = Dotted Orange Line
Current value: -25.33%
Note: Levolytics Research liquid strategy went live October 1, 2025.
Explanation:
Since our last update, we have had little changes to both the portfolio and our outlook. The market continues to move sideways. Upon review of our book, we decided to slightly reduce our beta exposure to the market. We expect trading volumes to remain light and indeterminant as we head through the Holiday season. As we approach the end of the year, we do expect some potential sell pressure as traders look to either harvest tax losses and/or secure their tax obligations.
Sign Off
The article speaks for itself. We all knew it was not a pretty picture over the past few years, but putting actual numbers to it drives the point home. The odds in the casino have increasingly shifted towards the sellers.
The average retail buy-and-hold participant has gotten fleeced repeatedly. Its doubtful this capital returns in the near term with the rise of prediction markets and venture-like public equities in expansionary fields.
That being said, not everything is a zero. From a medium to long term perspective, the eye-popping returns come from buying quality assets at bargain prices, which typically requires swimming against the current from a consensus perspective. Take your time, do your research, and place your bets accordingly, utilizing whatever risk management parameters apply to you. In the long run, optimism wins.
From the Levolytics team, we wish you all the happiest of Holiday seasons. The markets aren’t going anywhere. Be sure to enjoy this special time of the year!
Team Levolytics
Disclaimer
The performance results presented herein reflect proprietary trading activity conducted with internal capital only. No external capital is managed, accepted, or solicited. These results are unaudited and are provided solely for informational and research purposes.
Performance data represents the return on internal capital based on realized and unrealized gains and losses, net of trading fees and transaction costs, but before any taxes or potential operating expenses. The methodology used to calculate performance has been applied consistently; however, results have not been verified by any independent party.
Past performance is not necessarily indicative of future results. All investments involve risk, including the potential loss of principal. The information contained herein does not constitute an offer to sell or a solicitation of an offer to buy any security, investment fund interest, or other financial instrument.
Any opinions, estimates, or forward-looking statements are subject to change without notice and are provided for illustrative or educational purposes only.