
Equities bounced, what now for crypto?
Available to ALL subscribers | Discussion on the crypto market's response

Crypto market’s are attempting to break out from a multi-month range between $75,000 and $60,000.
Equities are showing signs of life, and doomers are likely in disbelief.
In The calm before the crypto storm we made the case for crypto being in a late stage bear market based on volume, open interest, lending, trend duration and the “final shoe to drop” - equities having a meltdown.
For weeks we’ve been talking about how an equities meltdown / rebound would give us a strong idea of where things stand with crypto.
Today we do this exact check in, and evaluate the potential for a possibly explosive rally in the coming weeks.
LETS GO.
TLDR
Crypto is coiling: Still rangebound ($60K–$75K), with low volatility signaling the bear trend isn’t fully broken yet.
Equities likely bottomed (short-term): Extreme bearish signals (90D lows breached, -9% median returns, VXX spike) → bounce confirmed, removing a key downside risk for crypto.
Altcoins are historically depressed:
~40% of Coinbase assets down >90%
Majority haven’t made new highs in 500+ days
→ Deep value conditions formingEarly bullish signals emerging:
Altcoins reclaiming 90DMA (first time since Oct 2025)
Net breadth rising (26%) → near breakout zone
But no volatility expansion yet → no confirmed bull trend
Leverage Liquidity Cycle something to watch: Still in a leverage destruction regime, but a bullish breakout could bring this to an end
Positioning: Increasing exposure (BTC/ETH focus), but still 67% cash → waiting for confirmation
VIDEO VERSION OF ARTICLE (35 MINS)
MARKET ANALYSIS
Equities bounced, and there were a lot of signals telling us that this was a possibility over the past few weeks:
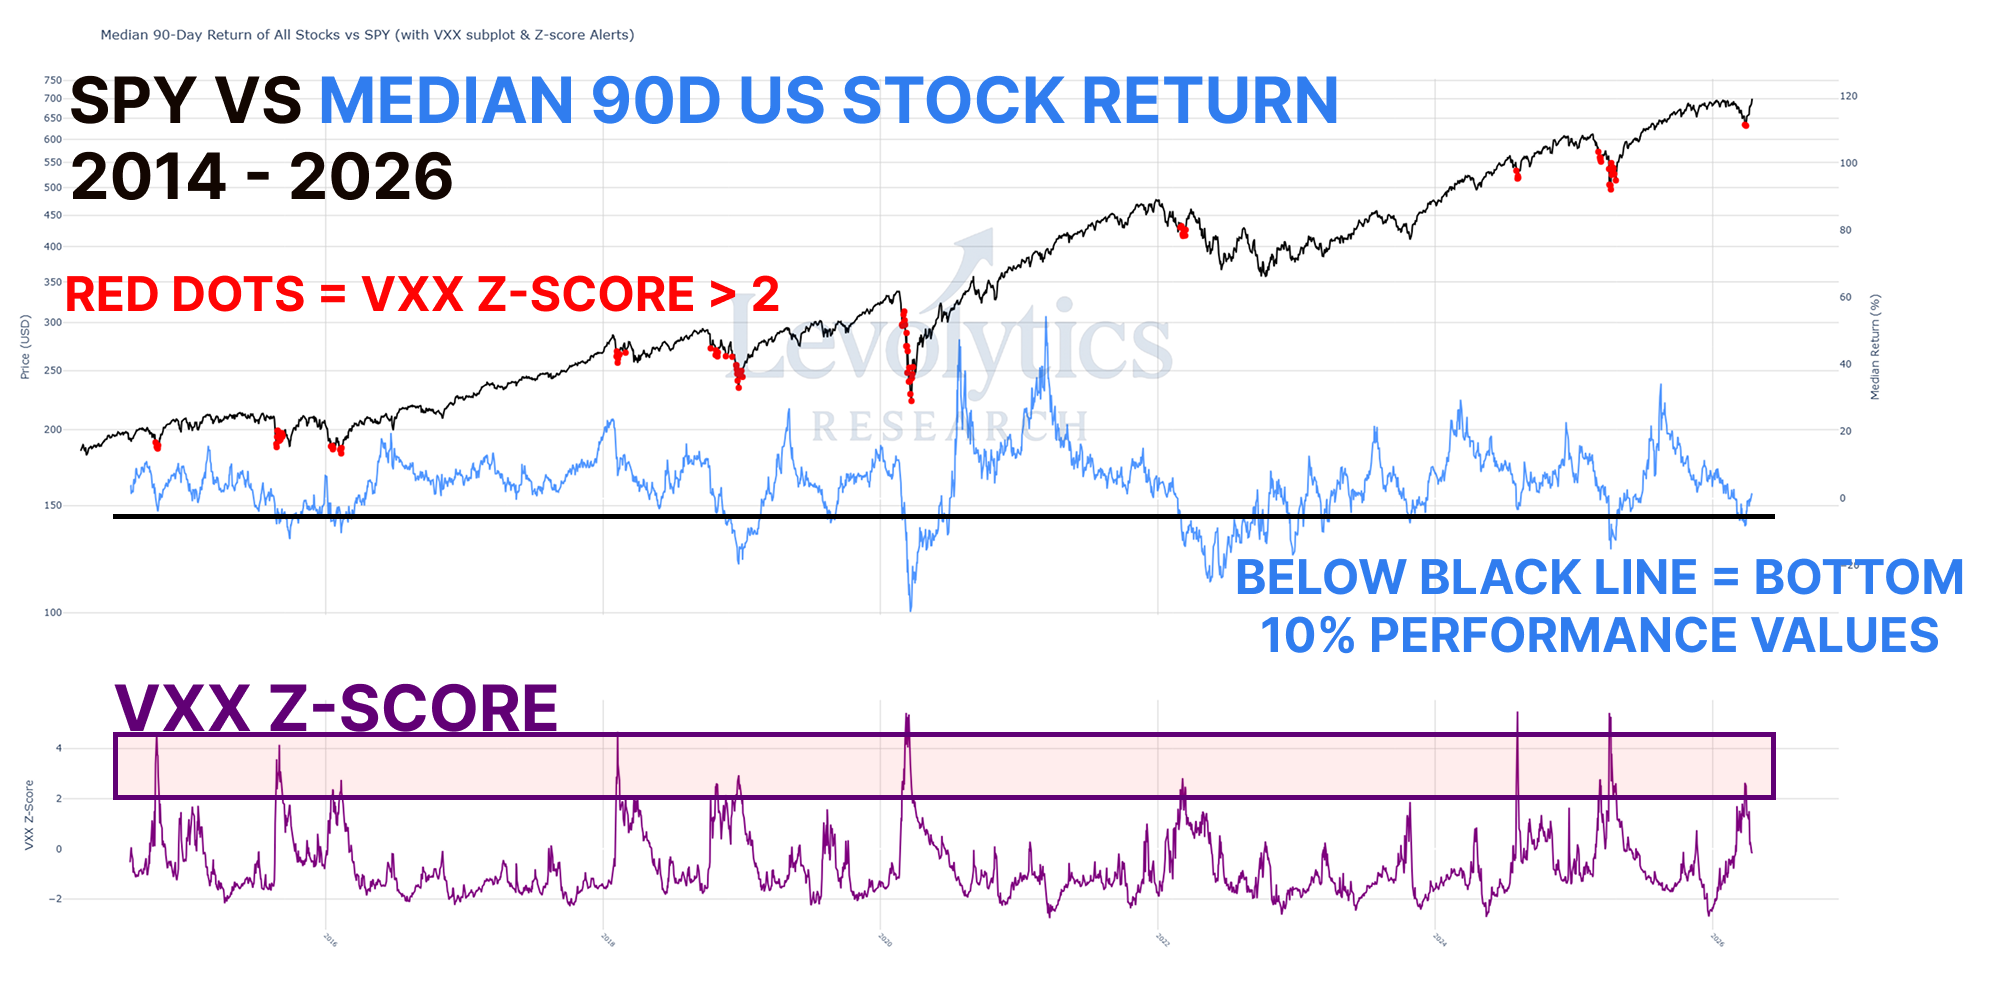
Large % of equities breaking to new 90-Day lows (See The calm before the crypto storm)
90D median returns for US stocks (chart above) hit -9%, which is within the bottom 10% of historical values
VXX Z-Score hit 2+, which is a once a year type of occurrence
Feels like any potential pressure from this angle for Crypto markets is working its way off the table.
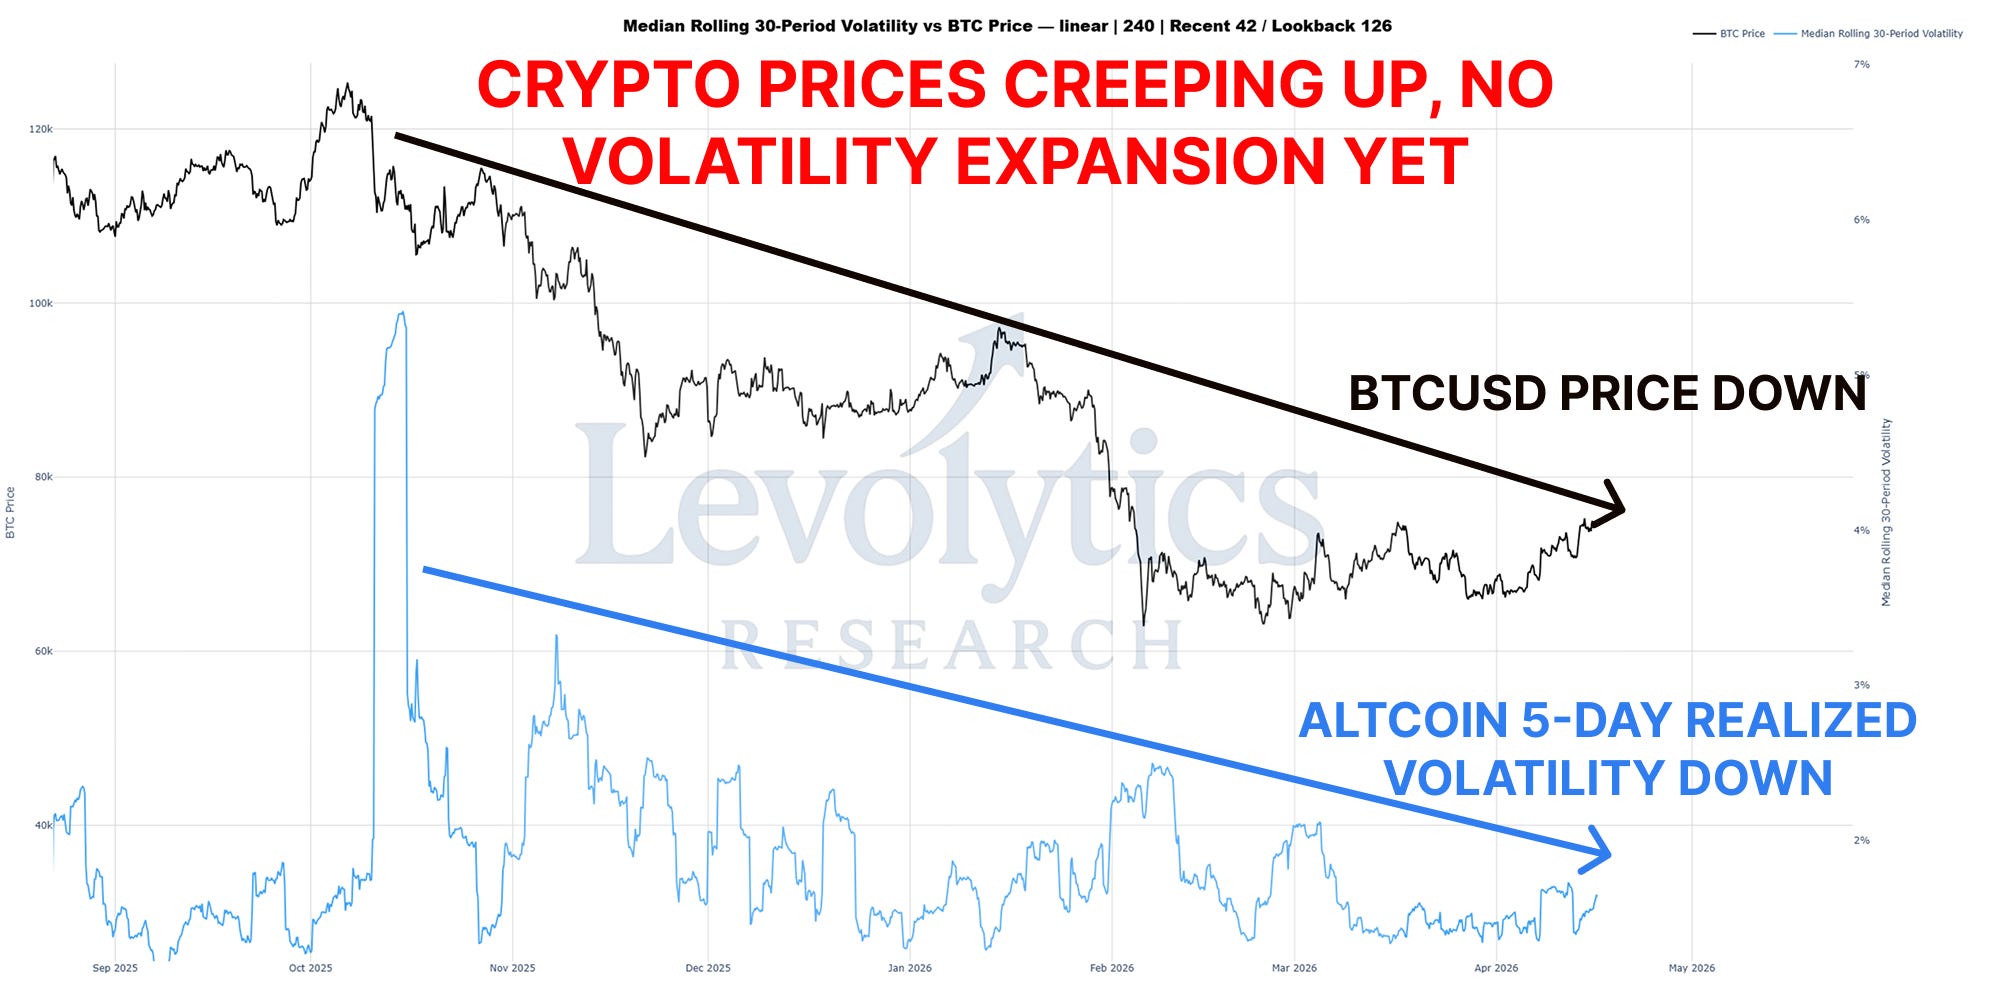
Crypto prices are up over the past week. BUT, there’s been no expansion in volatility - indicative of the fact that the bear trend is still intact.
Remember:
Bear trends = volatility dies off
Bull trends = volatility expands
The volatility expansion will be obvious when it occurs, in our opinion.
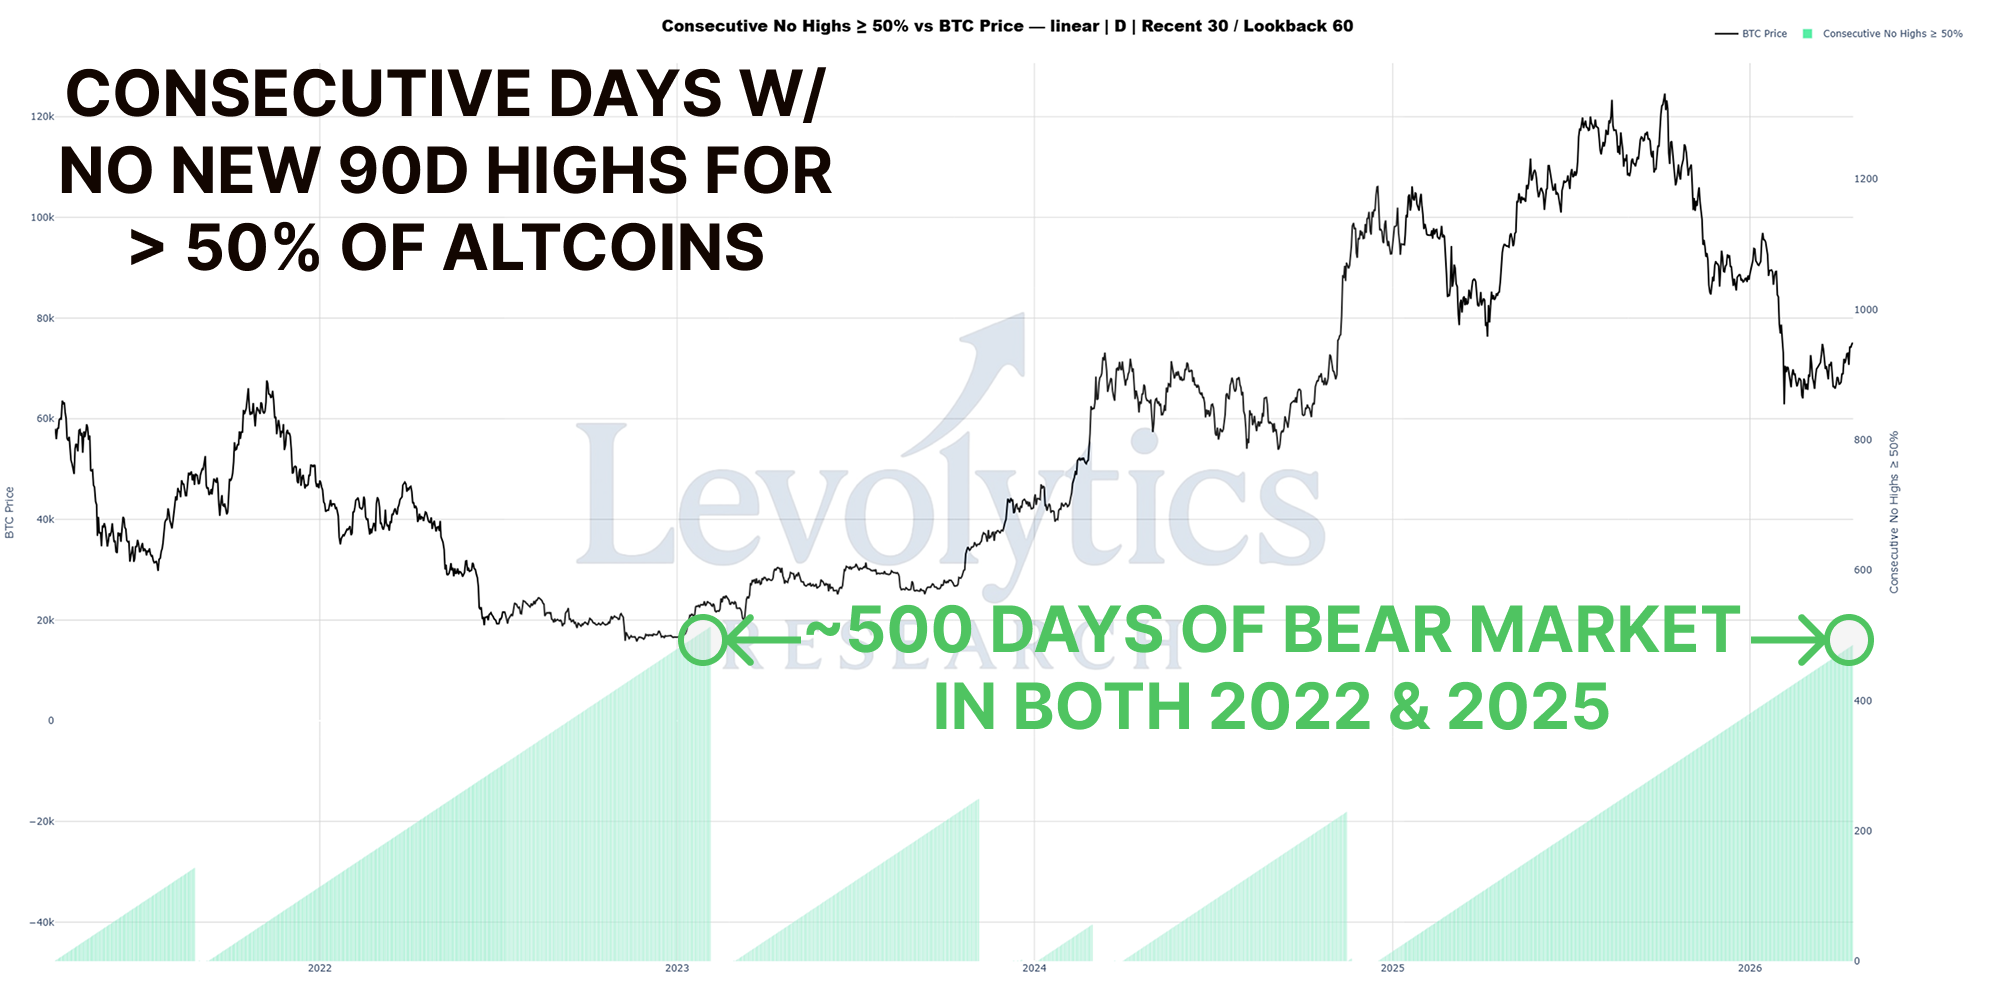
The bulk of altcoins haven’t made new 90-Day highs in over 500 DAYS.
As gross as this number is, there is good news:
2022 Bear Market = 512 Days
2025 Bear Market = 482 Days (and continuing)
Volatility remains compressed, and trend duration continues to climb the stairs.
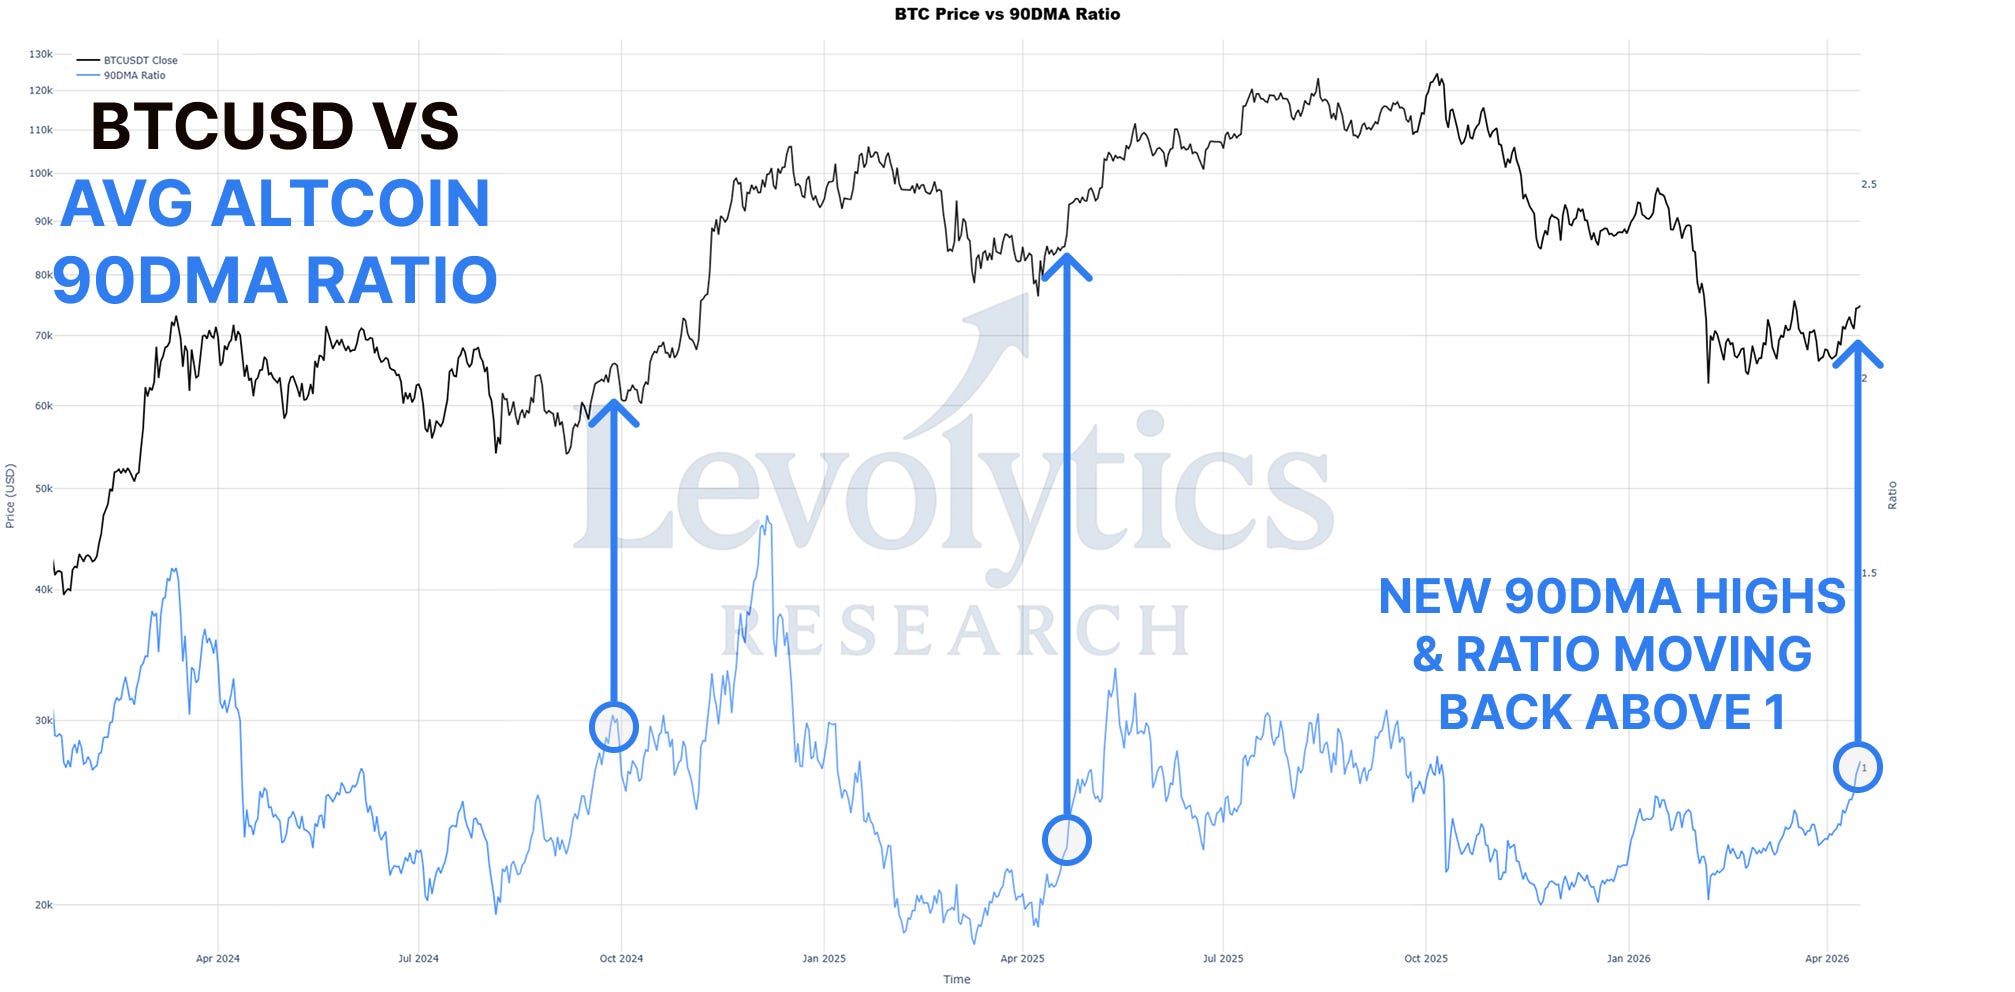
Here is a metric that’s sneaking into bullish territory.
The average altcoin 90DMA ratio printed new highs and closed above 1 (i.e. prices are on average above their respective 90DMAs) for the first time since October 2025.
While 90-Day % returns remain in negative territory, this strong print is encouraging to see because it indicates to us that price is at least lifting above the average price of this period.
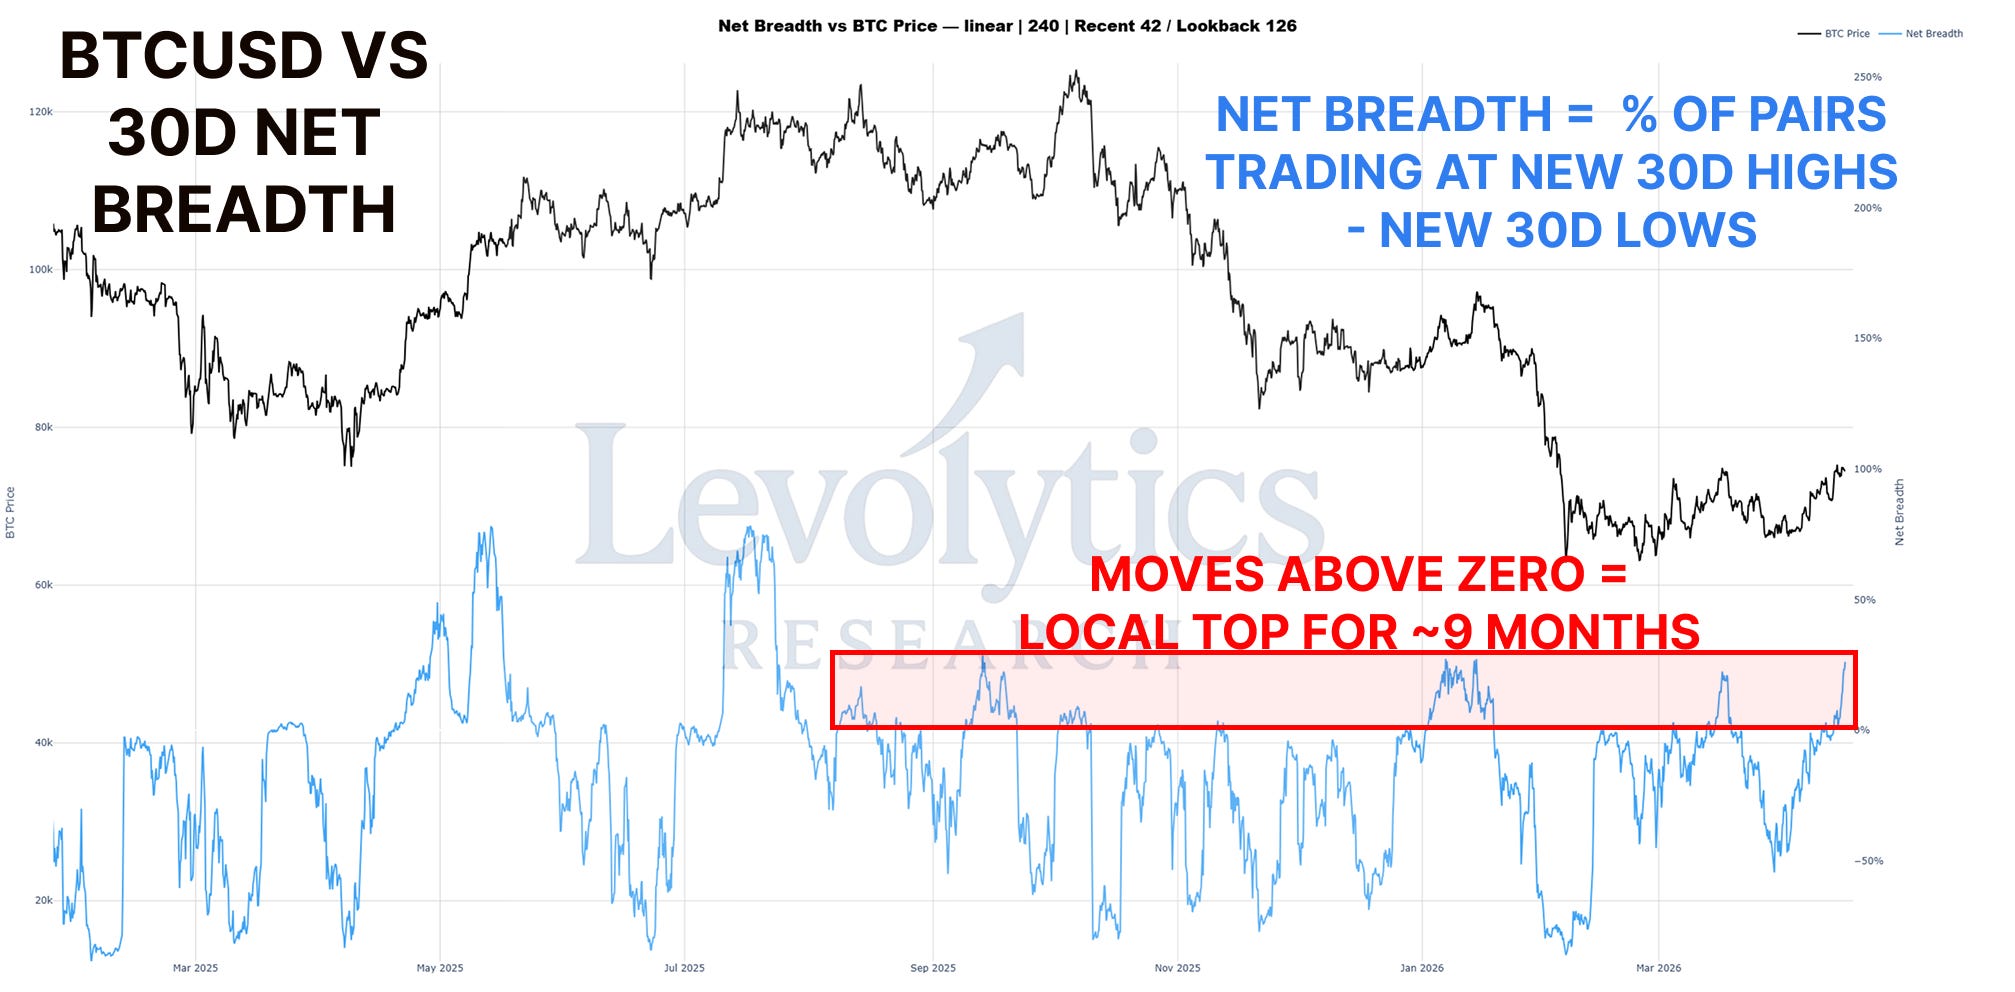
Net breadth is back into possible breakout territory, with a current value of 26%.
Ideally bulls step on the gas here - which would ignite the volatility spike that we’ve been waiting for.
If they don’t, always important to remember that this zone has created bearish reversals over the past 9 months.
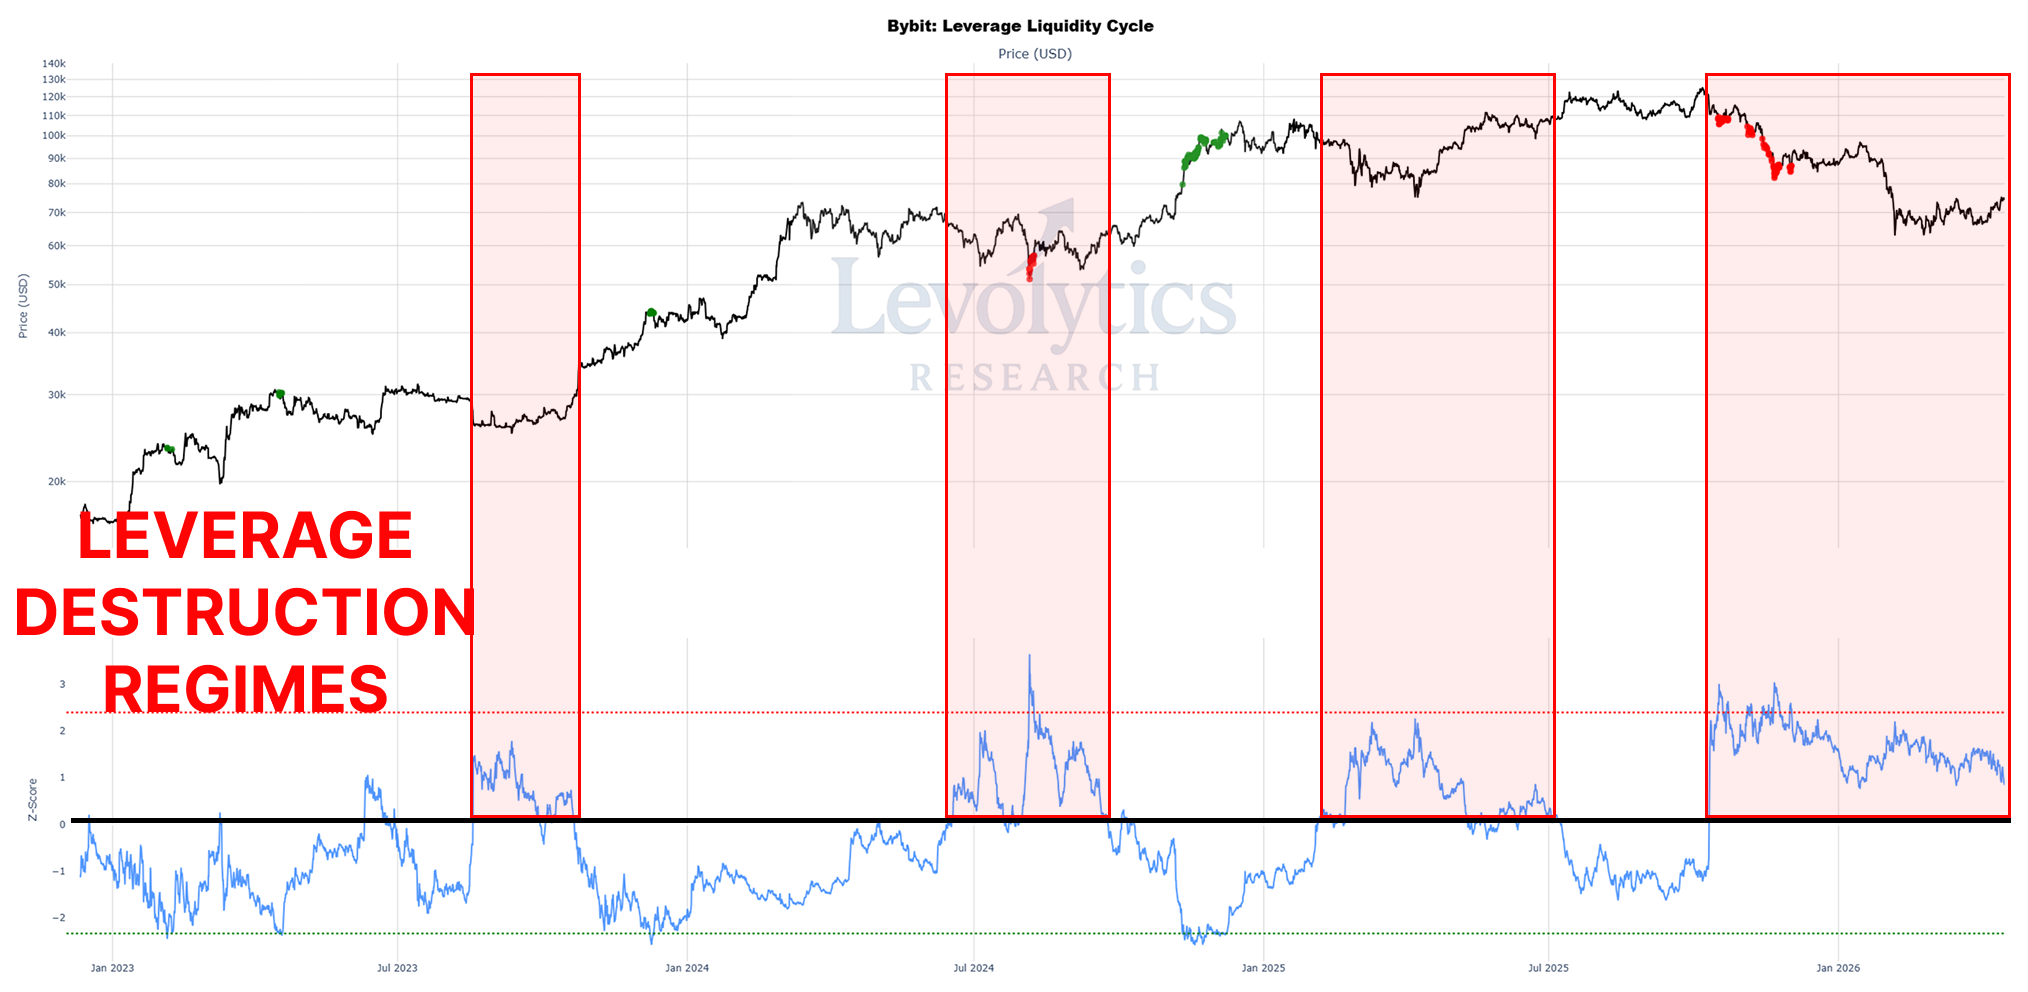
We introduced the Leverage Liquidity Cycle in Levolytics Research #5 (it was called Open Interest Forecast Z-Score within the article).
This metric illustrates the following: the $ growth of altcoin open interest tracks with the growth in number of pairs offered for trading.
Deep Positive values = Beginning of liquidity cycle = Relatively low leverage in crypto
Deep Negative values = Late liquidity cycle = Relatively high leverage in crypto
While deep negative values are something to be concerned about, the transition from positive to negative values usually is indicative of a new Leverage Liquidity Cycle kicking off (and these are usually paired with bullish price action).
PORTFOLIO UPDATES
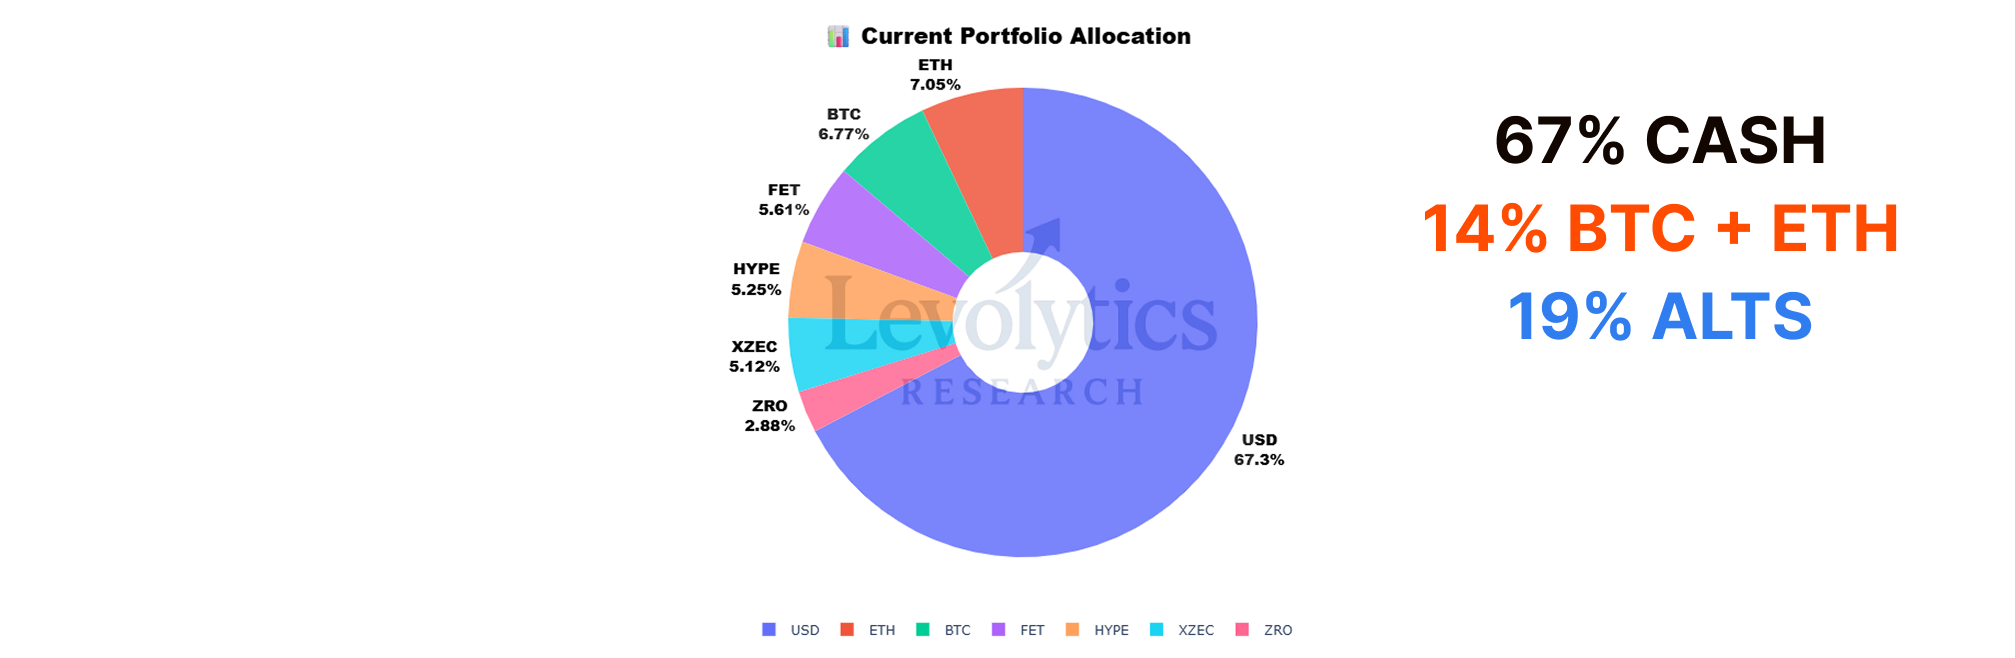
Since our last portfolio update, we’ve moved from 74% cash to 67% cash.
Our biggest positions are BTC and ETH, and we’re growing increasingly comfortable with holding Crypto large caps.
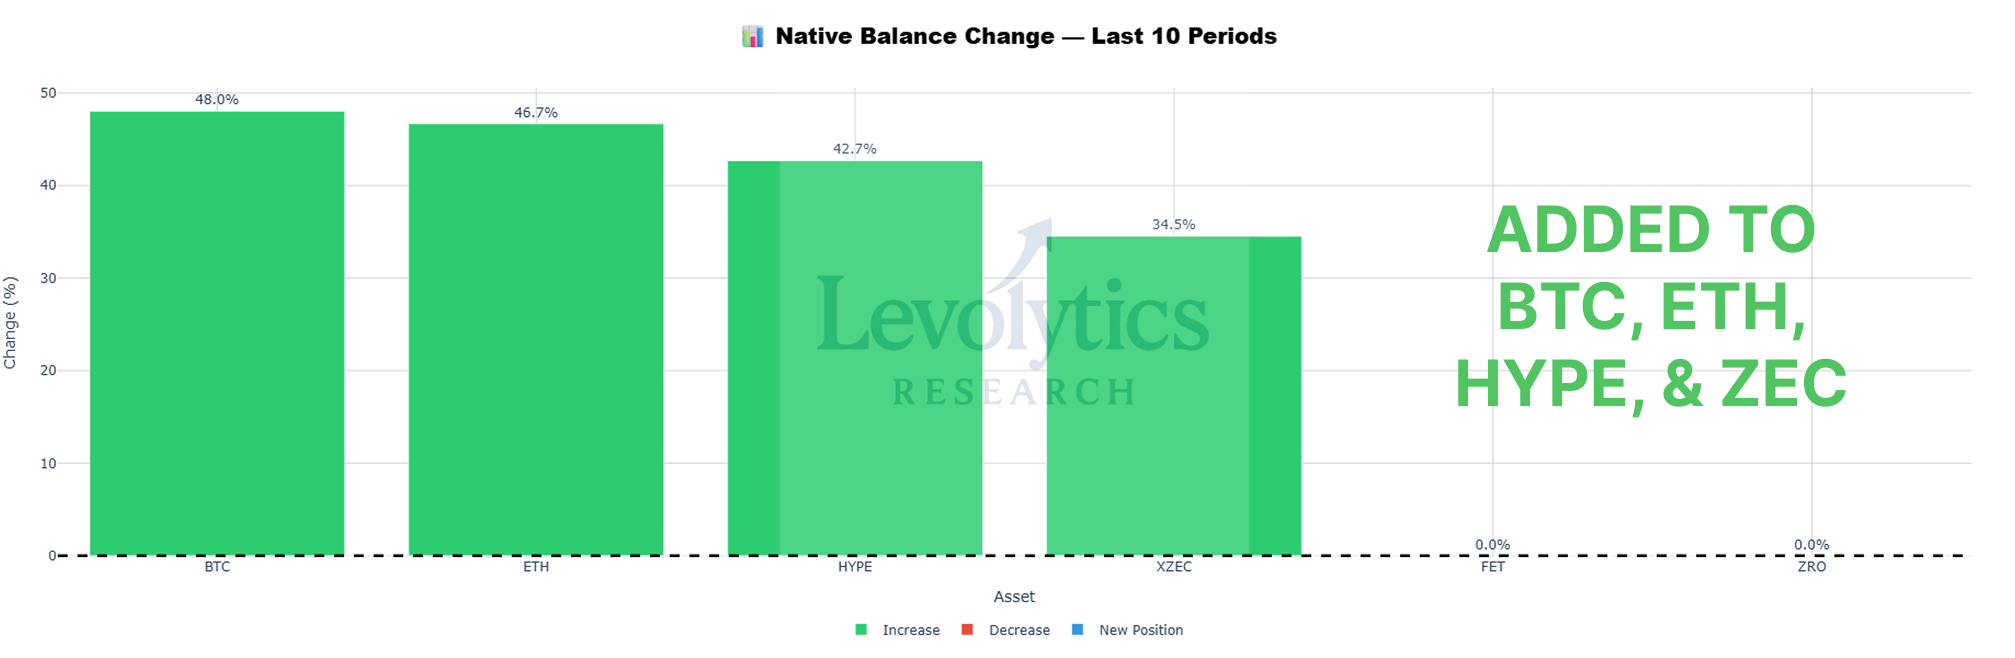
The chart here speaks for itself. We added to HYPE & ZEC because we had trading system longs trigger.
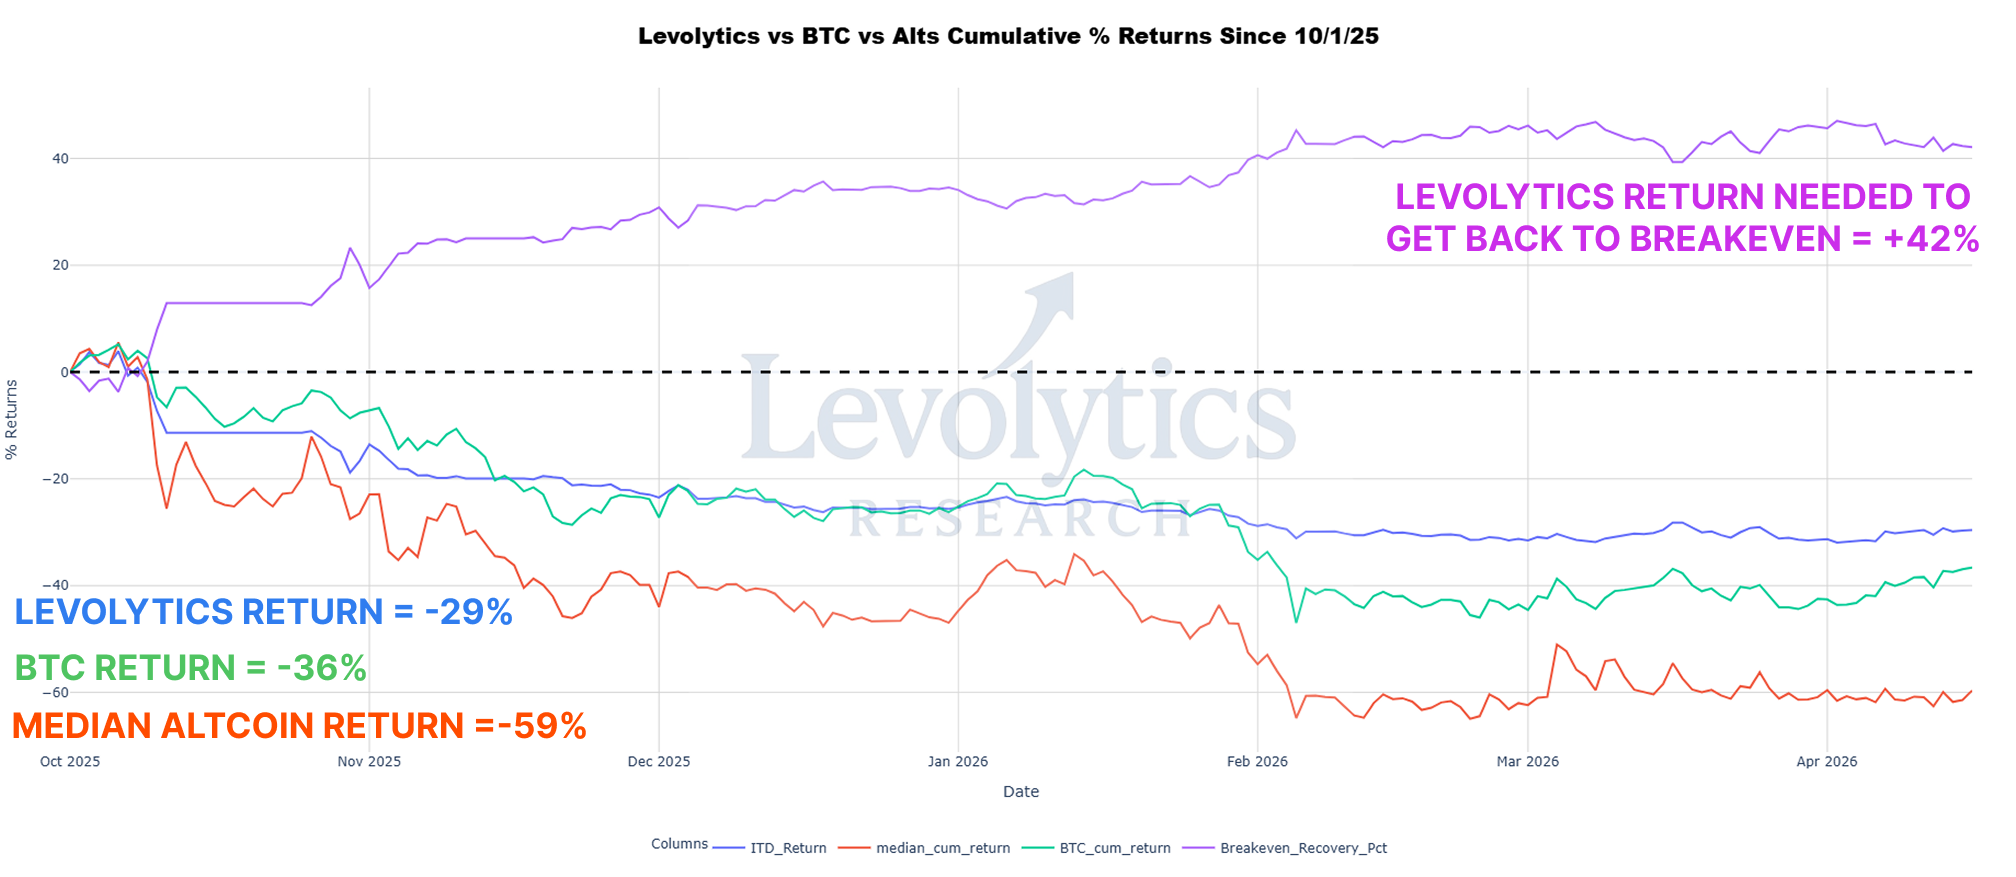
The most obvious thing you will notice from this chart is that BTC cumulative % returns are catching up to Levolytics portfolio returns.
As we’ve said before, we’ve been expecting this to happen due to the fact that we’re not 100% long.
Nonetheless, we think our portfolio exposure will trigger into a more longer positioning with plenty of time to shift our returns into gear (if the market starts trending).
CLOSING STATEMENT
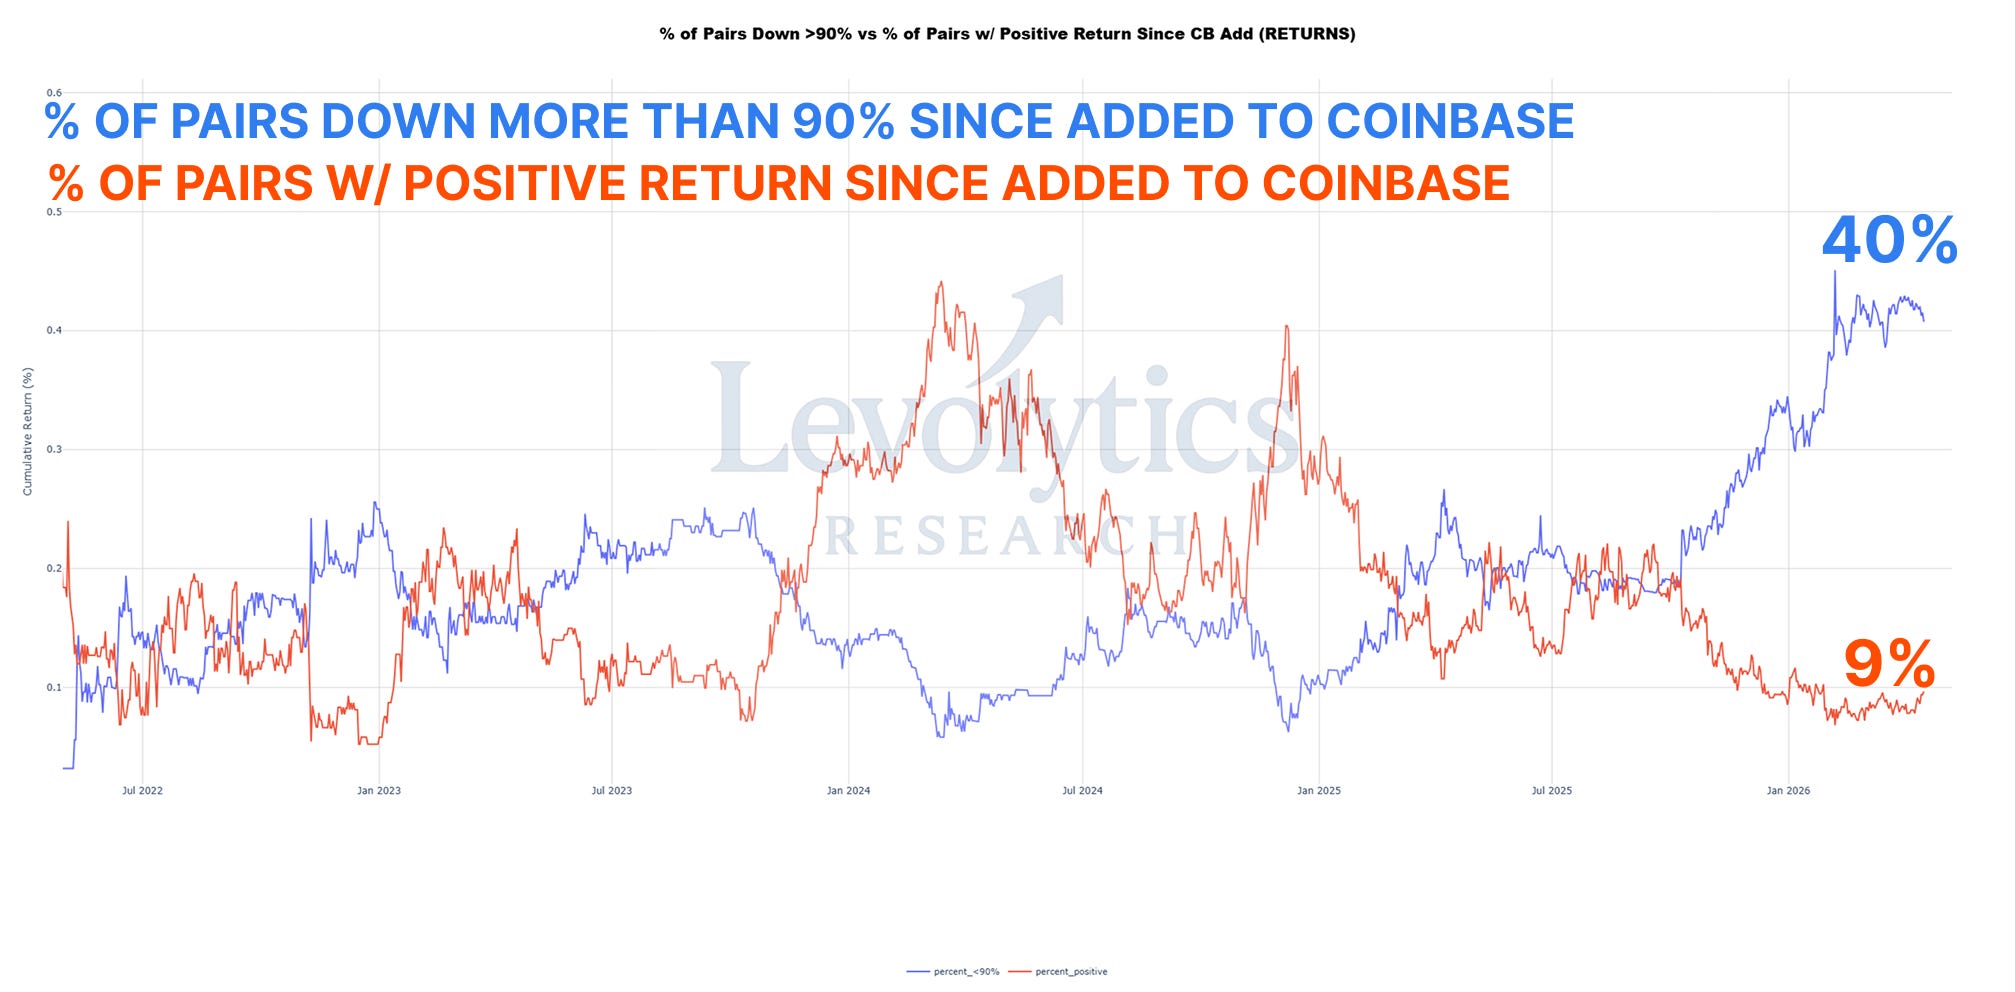
Here is the simple reality for traders and investors who are interested in buying at these levels: the market is absolutely cooked, and the odds that you are getting deep value (for the right assets) are seeming increasingly high.
When 40% of assets on Coinbase are down more than 90%, it is hard to ignore that widespread discount.
Our portfolio remains a bullish momentum only book, but something that we are considering with our non-Levolytics funds.
Stay strong, and do your homework.
Have a great weekend,
DISCLAIMER
The performance results presented herein reflect proprietary trading activity conducted with internal capital only. No external capital is managed, accepted, or solicited. These results are unaudited and are provided solely for informational and research purposes.
Performance data represents the return on internal capital based on realized and unrealized gains and losses, net of trading fees and transaction costs, but before any taxes or potential operating expenses. The methodology used to calculate performance has been applied consistently; however, results have not been verified by any independent party.
Past performance is not necessarily indicative of future results. All investments involve risk, including the potential loss of principal. The information contained herein does not constitute an offer to sell or a solicitation of an offer to buy any security, investment fund interest, or other financial instrument.
Any opinions, estimates, or forward-looking statements are subject to change without notice and are provided for illustrative or educational purposes only.