Crypto Markets Health Check #1
Edition #1 | Written as of November 6th, 2025

Introduction
Welcome to the first edition of Markets Health Check! Our weekly to-the-point metrics check.
If you enjoy the research, please subscribe and share our work with friends and colleagues.
Metrics Check
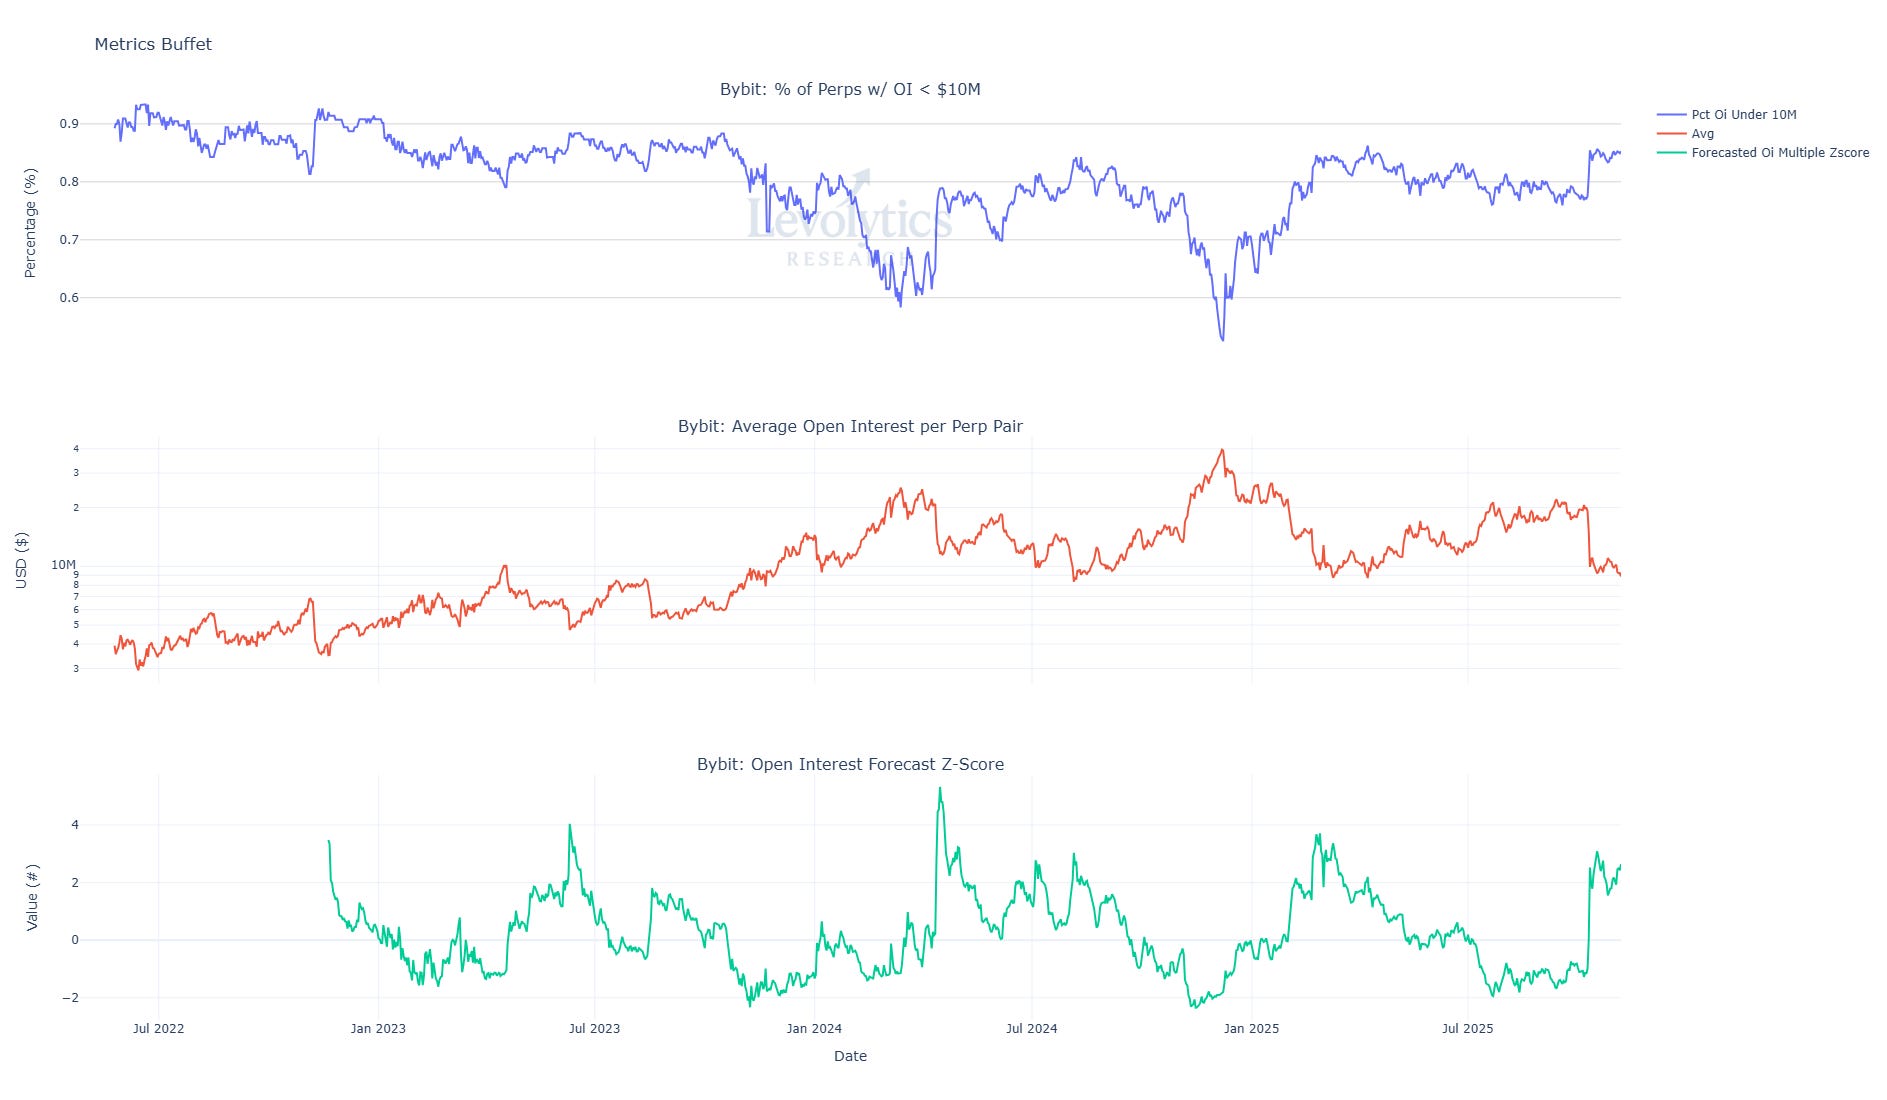
Metric 1: % of Perp Pairs with Open Interest < $10M
Current Value = 85%
Metric 2: Average Open Interest per Perp Pair
Current Value = $8.86M
Metric 3: Open Interest Forecast Z-Score (Explained in Levolytics Research #5)
Current Value = 2.64
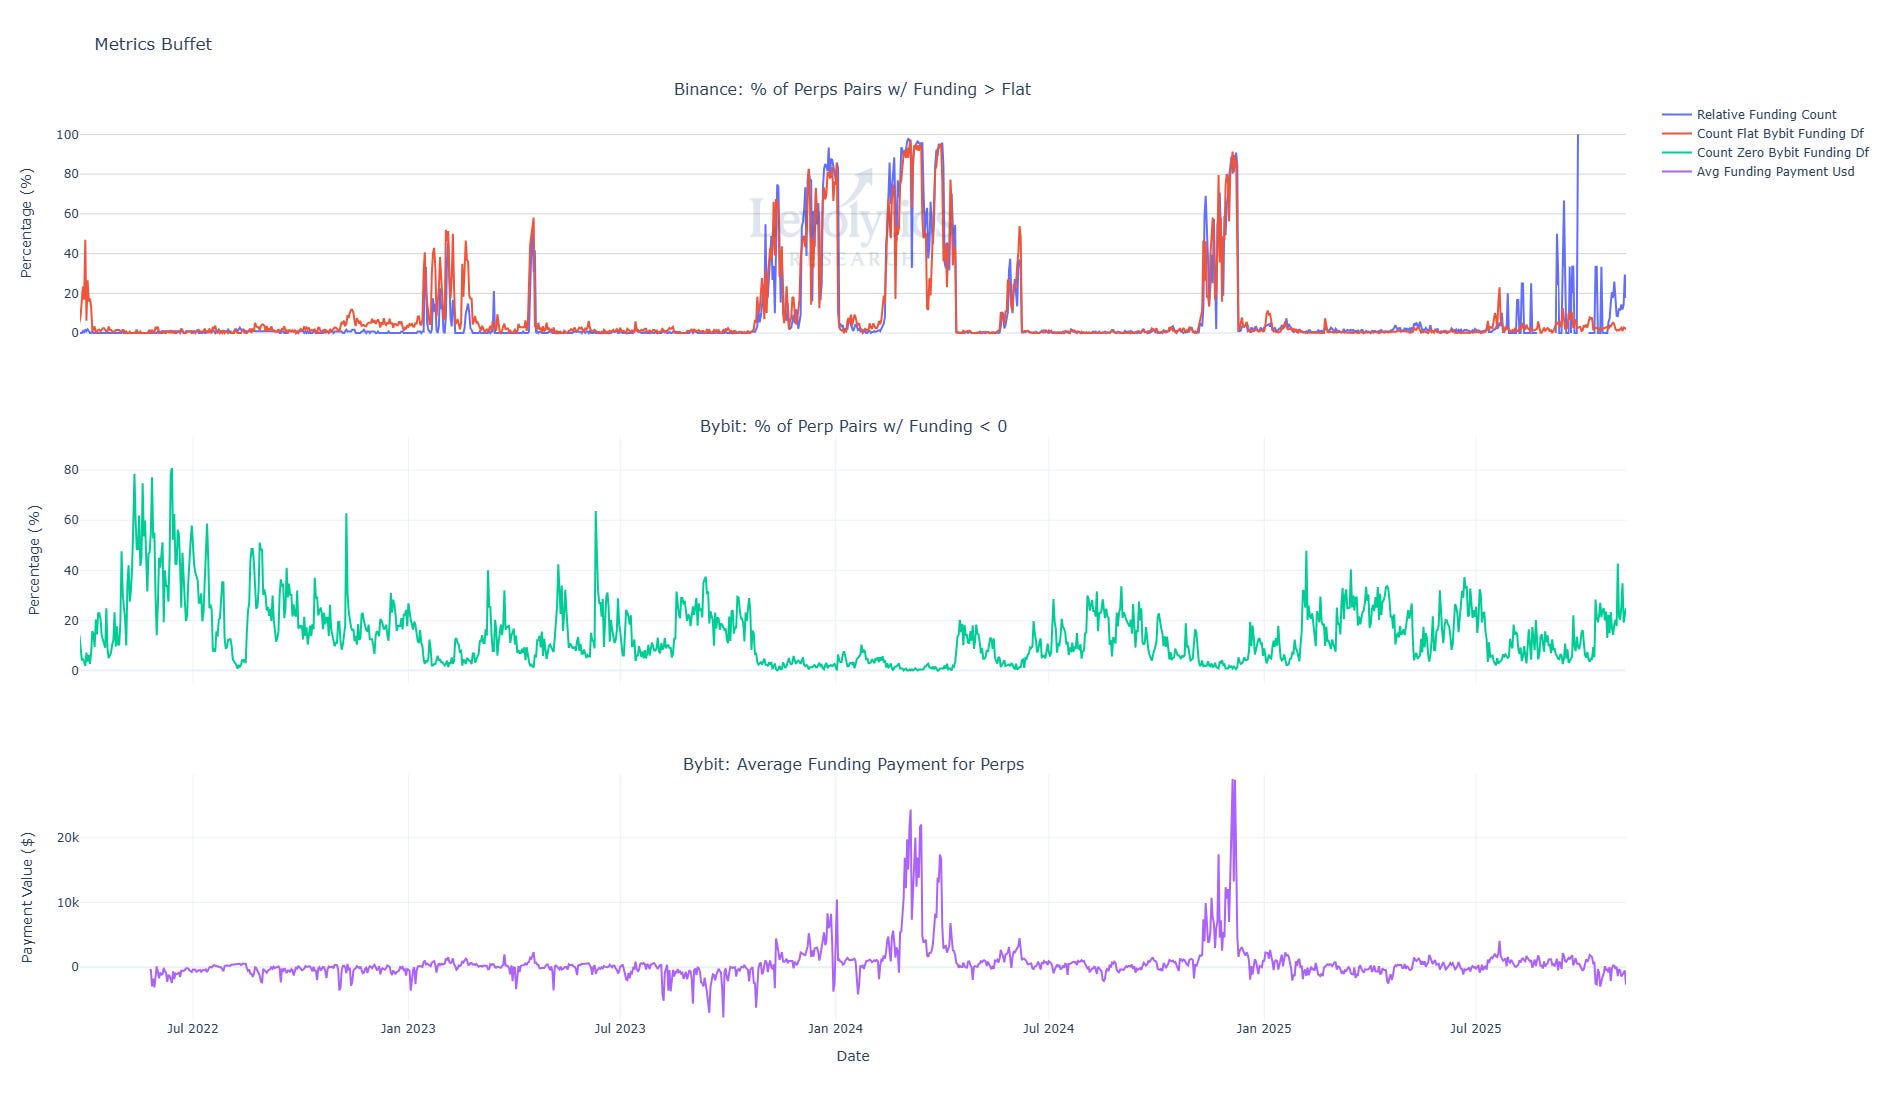
Metric 1: % of Perp Pairs with Funding > Flat
Current Value (Binance) = 17%
Current Value (Bybit) = 1.79%
Divergence began July 2025: to be researched
Metric 2: % of Perp Pairs with Funding < 0
Current Value = 25%
Metric 3: Average Funding Payment for Perps
Current Value = -$2,700
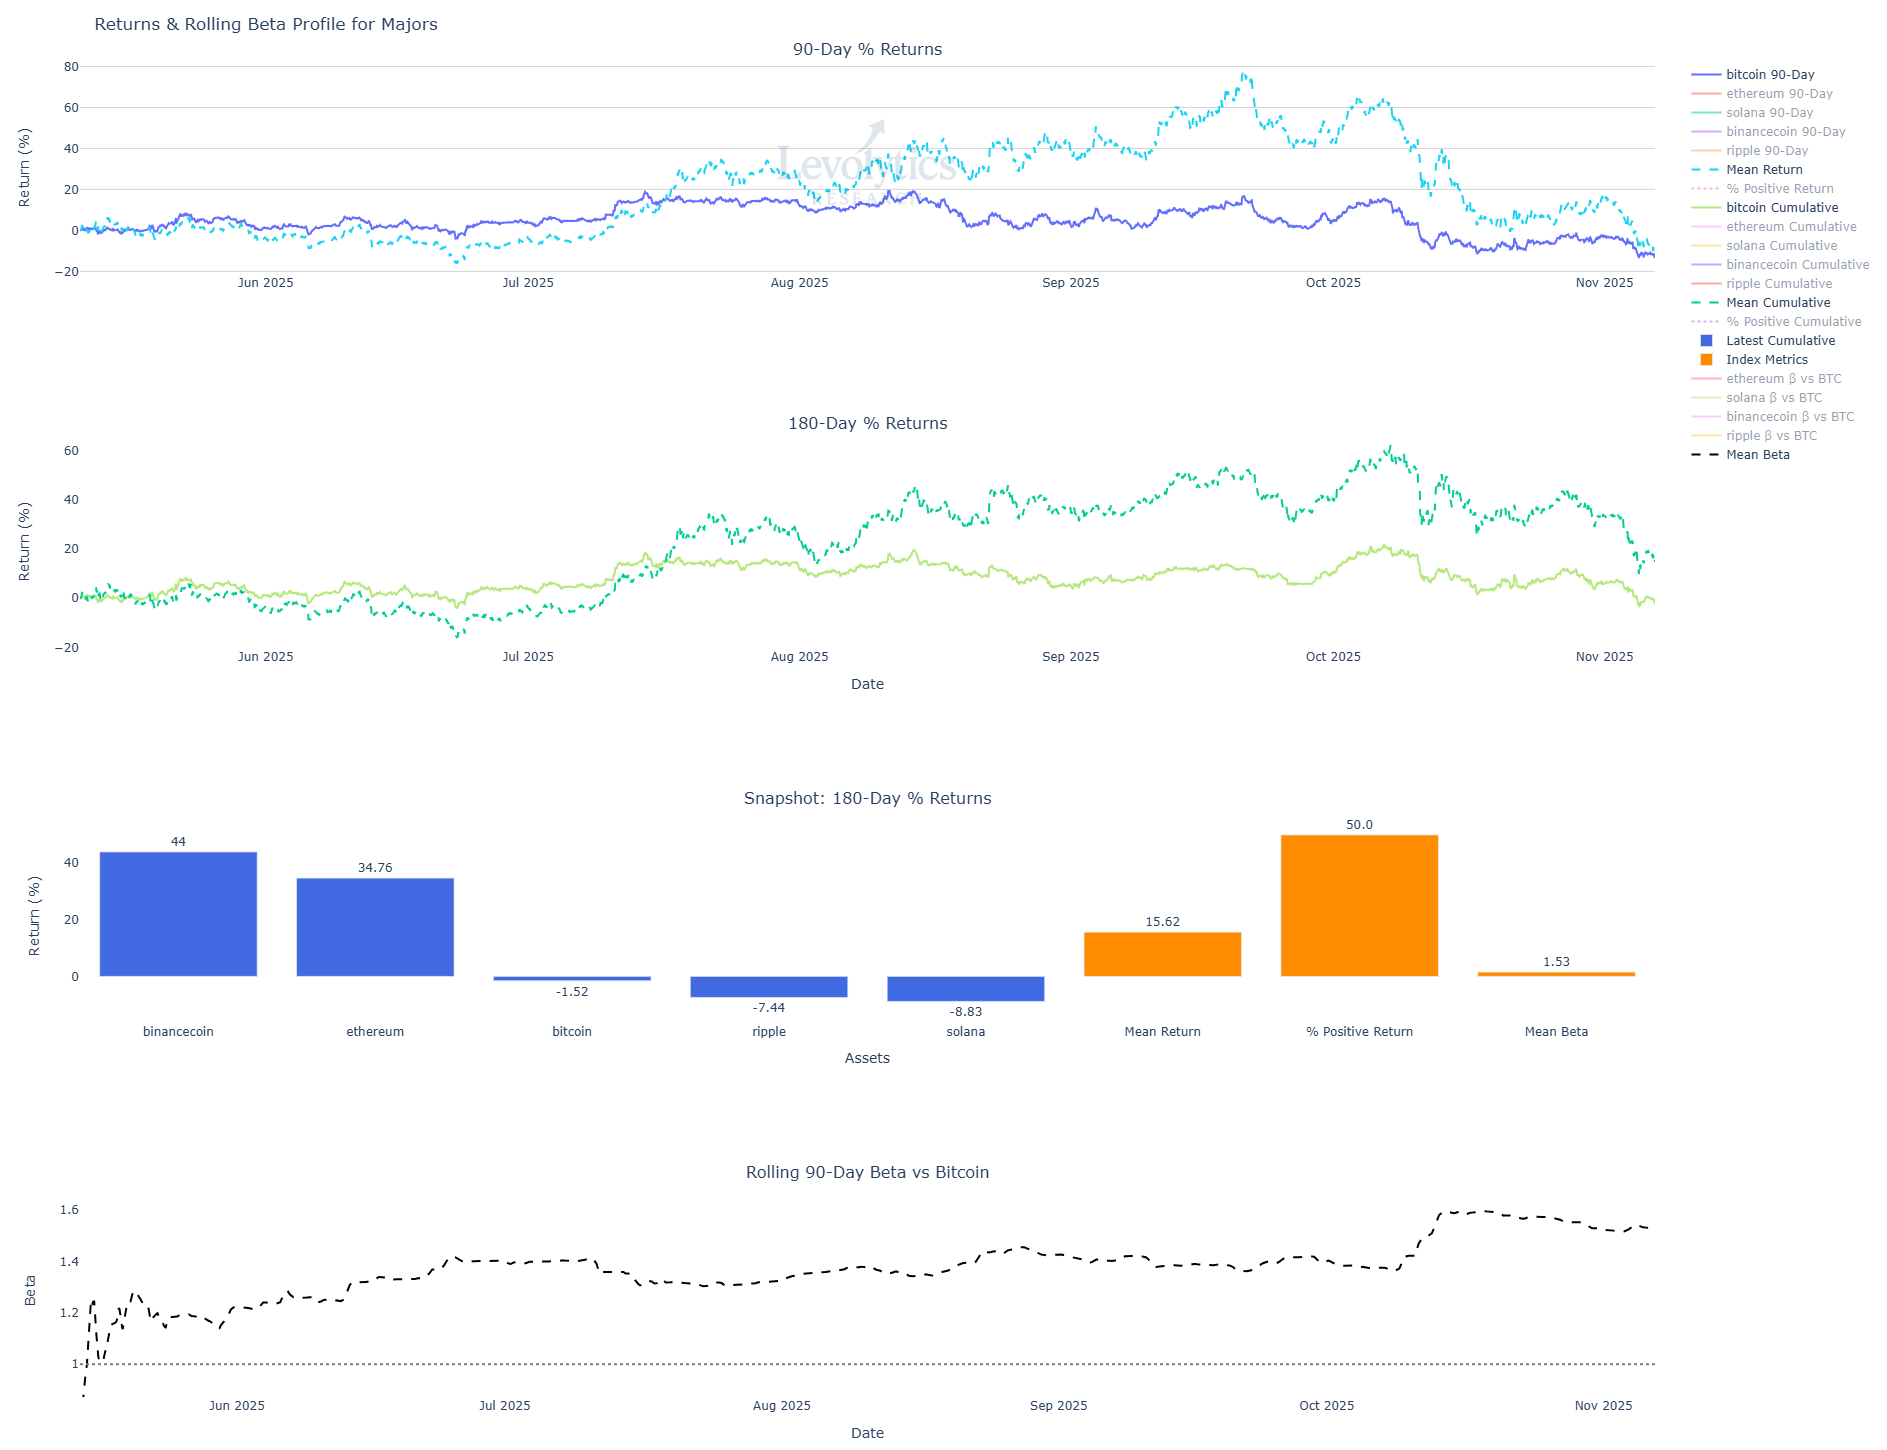
Metric 1: Average 90-Day % Return for Majors Index vs Bitcoin 90-Day % Return
Majors Index = -9%
Bitcoin = -13%
Metric 2: Average 180-Day % Return for Majors Index vs Bitcoin 180-Day % Return
Majors Index = +15%
Bitcoin = -2%
Subplot 3: Snapshot of 180-Day % Returns, Mean 180-Day % Return for Majors Index, % of Assets within Majors Index w/ Positive Return Over 180 Days & Average Beta for Majors Index (Only metric that is 90 Days here)
2 of 4 assets in the Majors Index have outperformed Bitcoin over the past 180 days
Subplot 4: Rolling 90-Day Average Beta for Majors Index Assets
Current Value = 1.52
Majors Index assets move +/-1.52% for each Bitcoin +/-1% move
Results
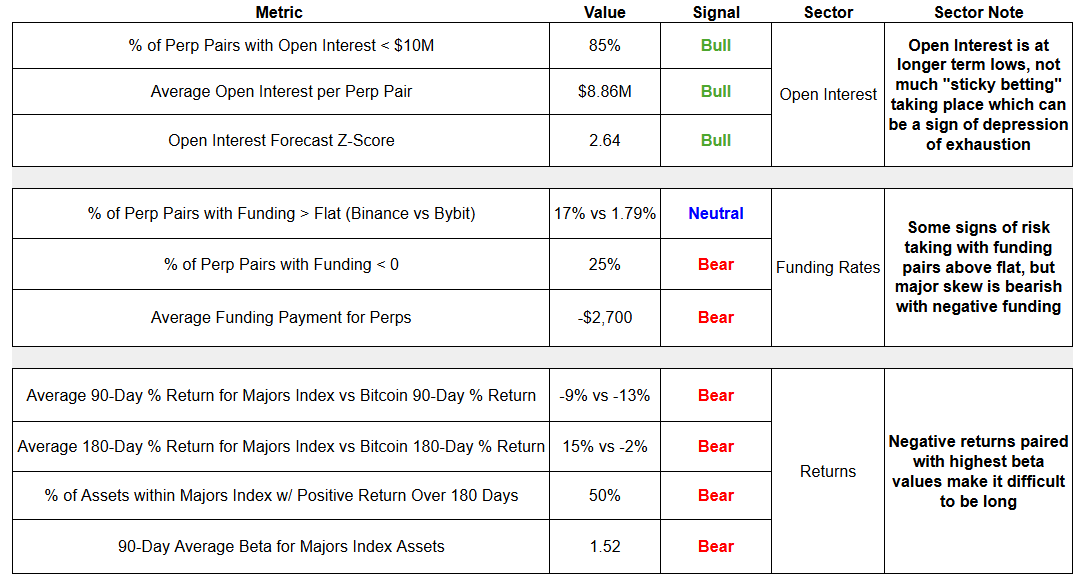
Summary: Sentiment is very negative, returns are negative over higher timeframes for BTC, and volatility is increasing for major alts. These are difficult trading conditions. Low open interest values are constructive as they signal longer term degen exhaustion.
Disclaimer
The performance results presented herein reflect proprietary trading activity conducted with internal capital only. No external capital is managed, accepted, or solicited. These results are unaudited and are provided solely for informational and research purposes.
Performance data represents the return on internal capital based on realized and unrealized gains and losses, net of trading fees and transaction costs, but before any taxes or potential operating expenses. The methodology used to calculate performance has been applied consistently; however, results have not been verified by any independent party.
Past performance is not necessarily indicative of future results. All investments involve risk, including the potential loss of principal. The information contained herein does not constitute an offer to sell or a solicitation of an offer to buy any security, investment fund interest, or other financial instrument.
Any opinions, estimates, or forward-looking statements are subject to change without notice and are provided for illustrative or educational purposes only.