
Is Crypto in a bull trend?
Discussing the possibility that Crypto markets have quietly shifted into a bull trend

Crypto markets have been sleepy relative to other markets for a very long time now.
However, in recent weeks there have been signs that the tide has shifted, and that the trend (along with future expectations of price action) is up.
Below we’ll highlight a handful of metrics that can help with what is usually the most simple type of analysis: trend identification.
The purpose of this exercise is to build confluence of the big picture trend: if you get the trend right, everything else becomes easier.
Metrics below will leverage returns data, perps open interest data, perps funding rate data, and more…
Let’s get into it!
All metrics available on Dude Terminal.
These specific chart constructions are currently private and powered by Dude Terminal’s AI implementation.
TLDR
BTC remains trapped between the critical $75K–$80K range, with a violent move likely coming soon.
Break above $80K → potential move toward $95K.
Breakdown below $75K → risk of sharp selloff toward low $60Ks.
OI/Volume Ratio data suggests traders are heavily positioned, increasing odds of an explosive move.
Funding rates have finally turned positive after ~6 months of persistent negativity → risk appetite is returning to Crypto.
Altcoins are beginning to outperform Tech equities, historically a strong sign for broader Crypto strength.
Market-wide capitulation likely occurred in late Jan / early Feb 2026 after prolonged bearish trends + deeply oversold conditions.
Portfolio positioning remains constructive: long BTC with selective Alt exposure (ZEC, HYPE, NEAR), while watching VIRTUALS for potential breakout strength.
Big picture trend is improving — now bulls need to prove they can force the breakout.
VIDEO VERSION OF ARTICLE (40 MINS)
MARKET ANALYSIS
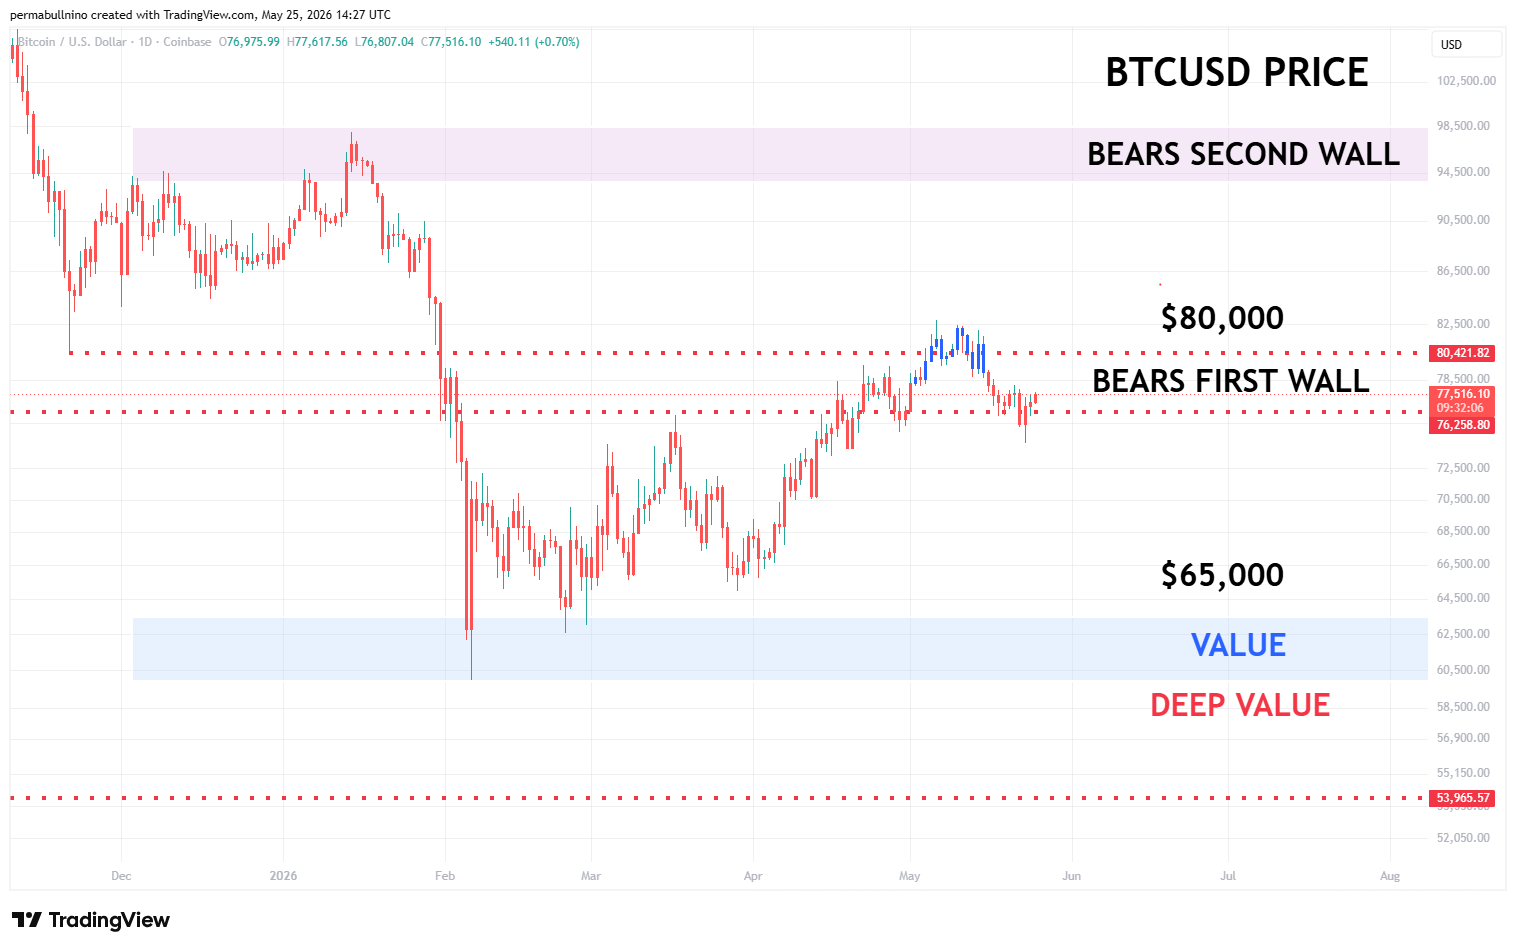
BTC remains pinned within the “Bears First Wall” between $76,000 and $80,000.
If the goal of the market gods is to make people as comfortable as possible, mission accomplished.
Expectations remain unchanged:
If breakdown below $75,000 - $76,000 zone = violent move downwards to low $60,000 region
If breakout above $80,000 = violent move towards Bears Second Wall around $95,000
From a price action perspective, momentum is bearish (see red candles). That needs to be respected in some capacity - momentum will flip back to bullish on a revisit to the $80,000 level.
If that occurs, I believe that is a spot where BTC bulls will attempt to pour on the momentum.
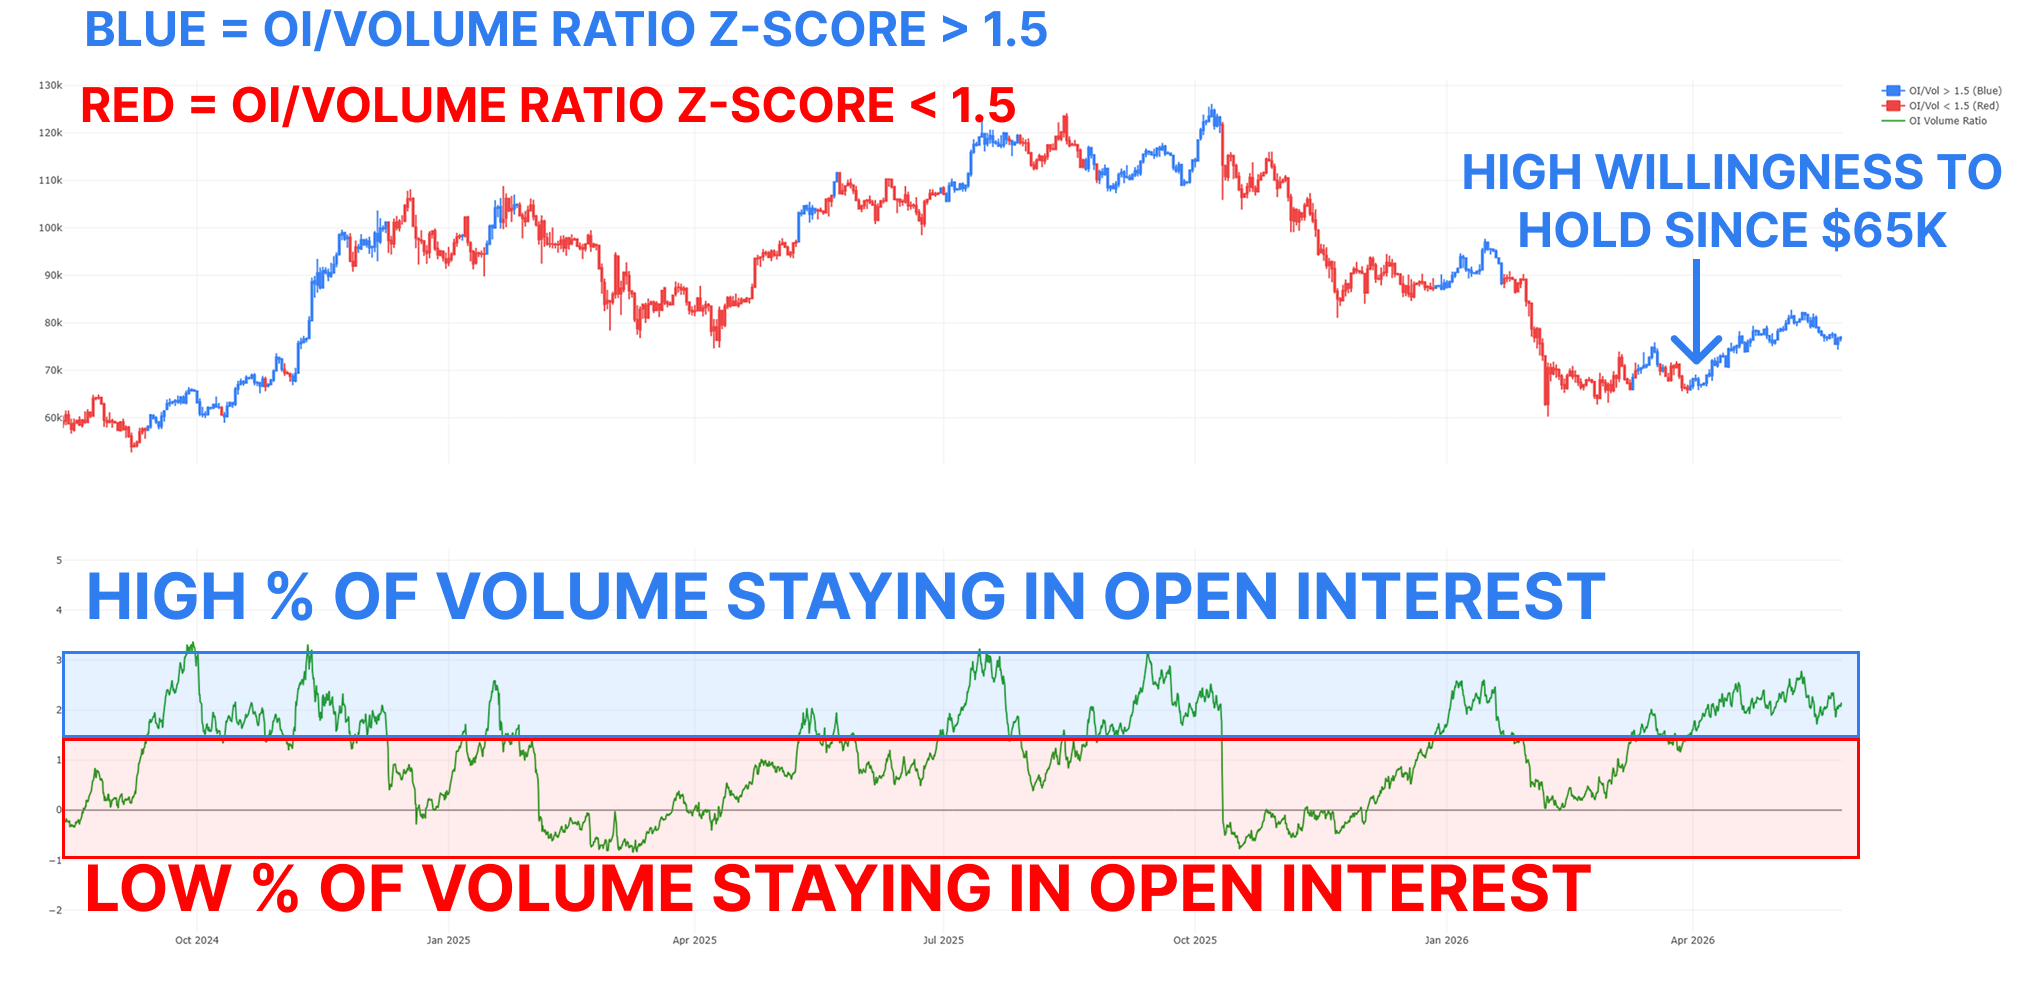
My expectations for violence are based on the OI-Volume Ratio Z-Score, which tracks the % of volume absorbed into open interest over a 30-day span.
Persistent, high values generally precede:
Price rallies
Violent bearish reversals
What this means for this current set up:
Bull: Decisive move to $95,000 which will likely silence late bears for good
Bear: Panicky nosedive in price on a break below $75,000
Traders are holding their positioning with conviction, and somebody is bound to get hurt (soon).
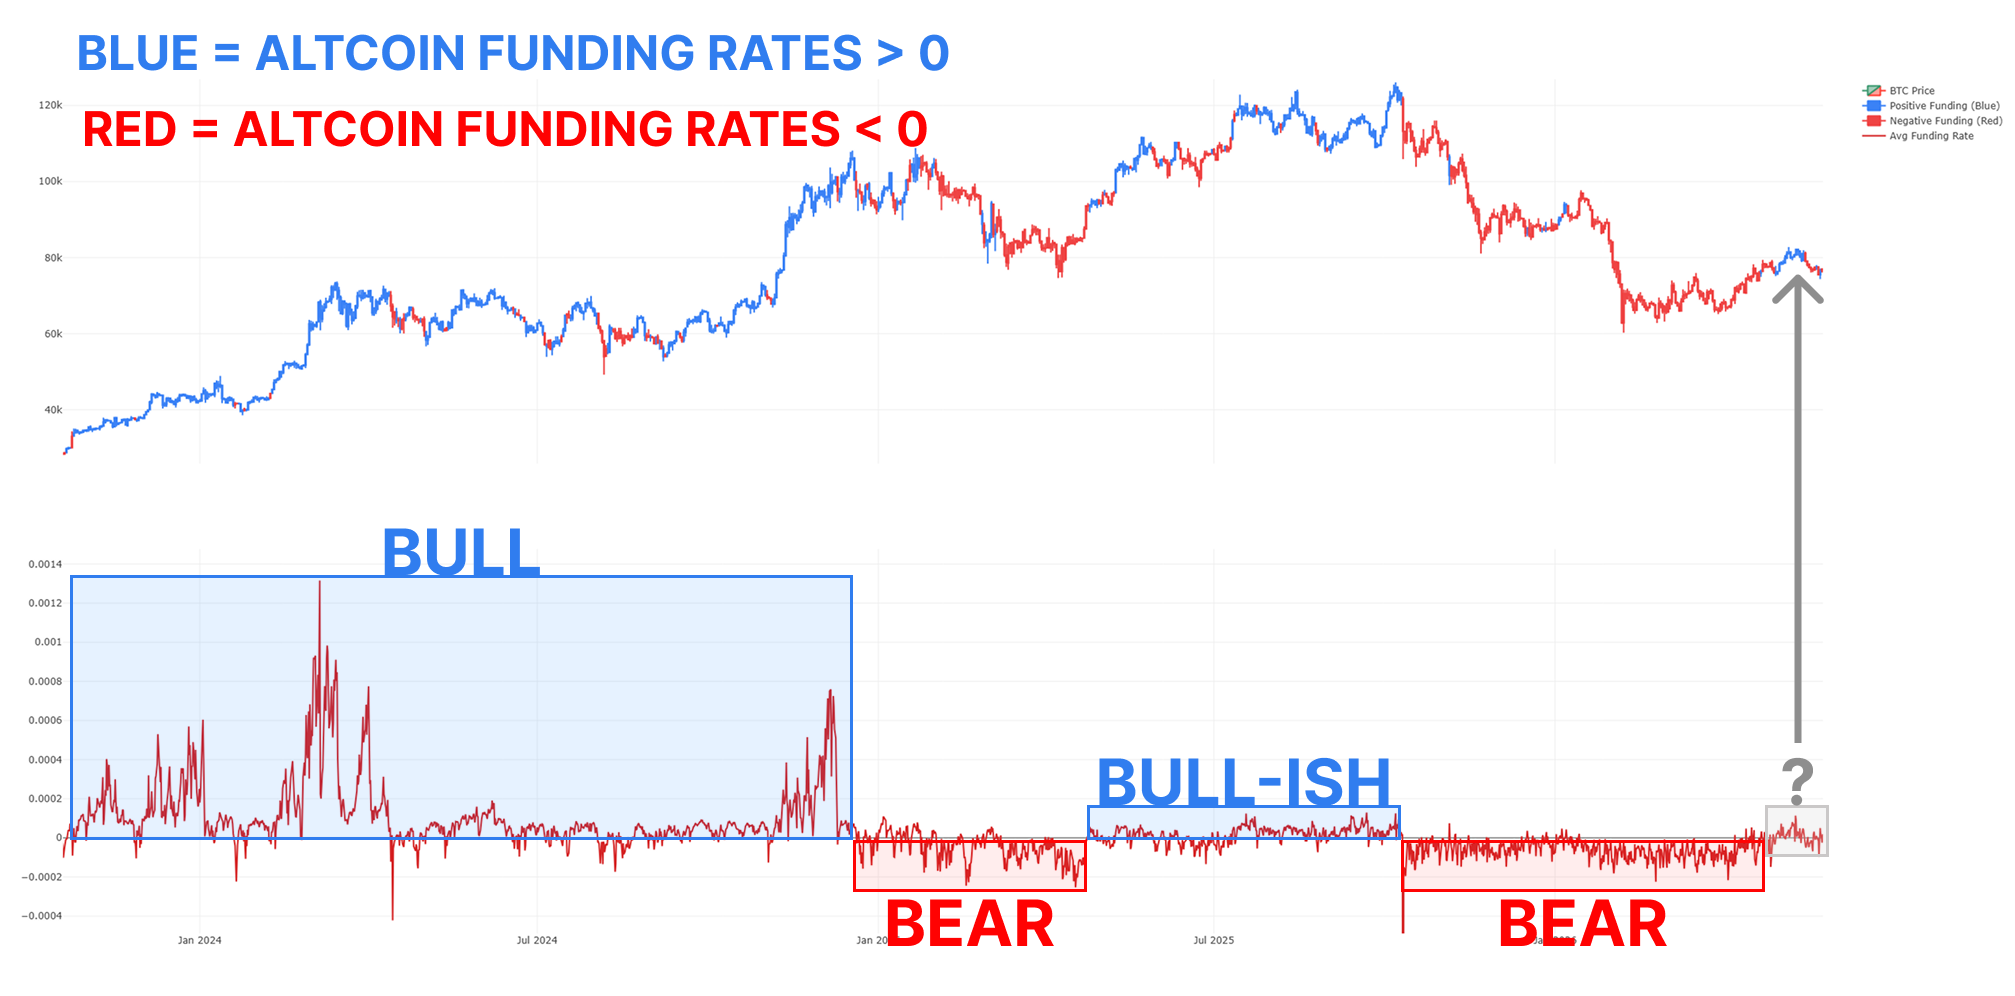
Funding rates are the simplest signal for understanding the risk appetite of market participants.
The chart above displays the following:
Funding > 0 = Risk appetite for Crypto exists
Pairs with more favorable / bullish price action
Funding < 0 = Risk appetite for Crypto non-existent
Pars with less favorable / bearish price action
After 6 months of persistently negative funding rates, there are finally signs of risk appetite returning to Crypto markets.
Also - considering how devastating October 10th, 2025 was to perpetual swap markets, this potentially a strong signal that market participants have licked their wounds enough.
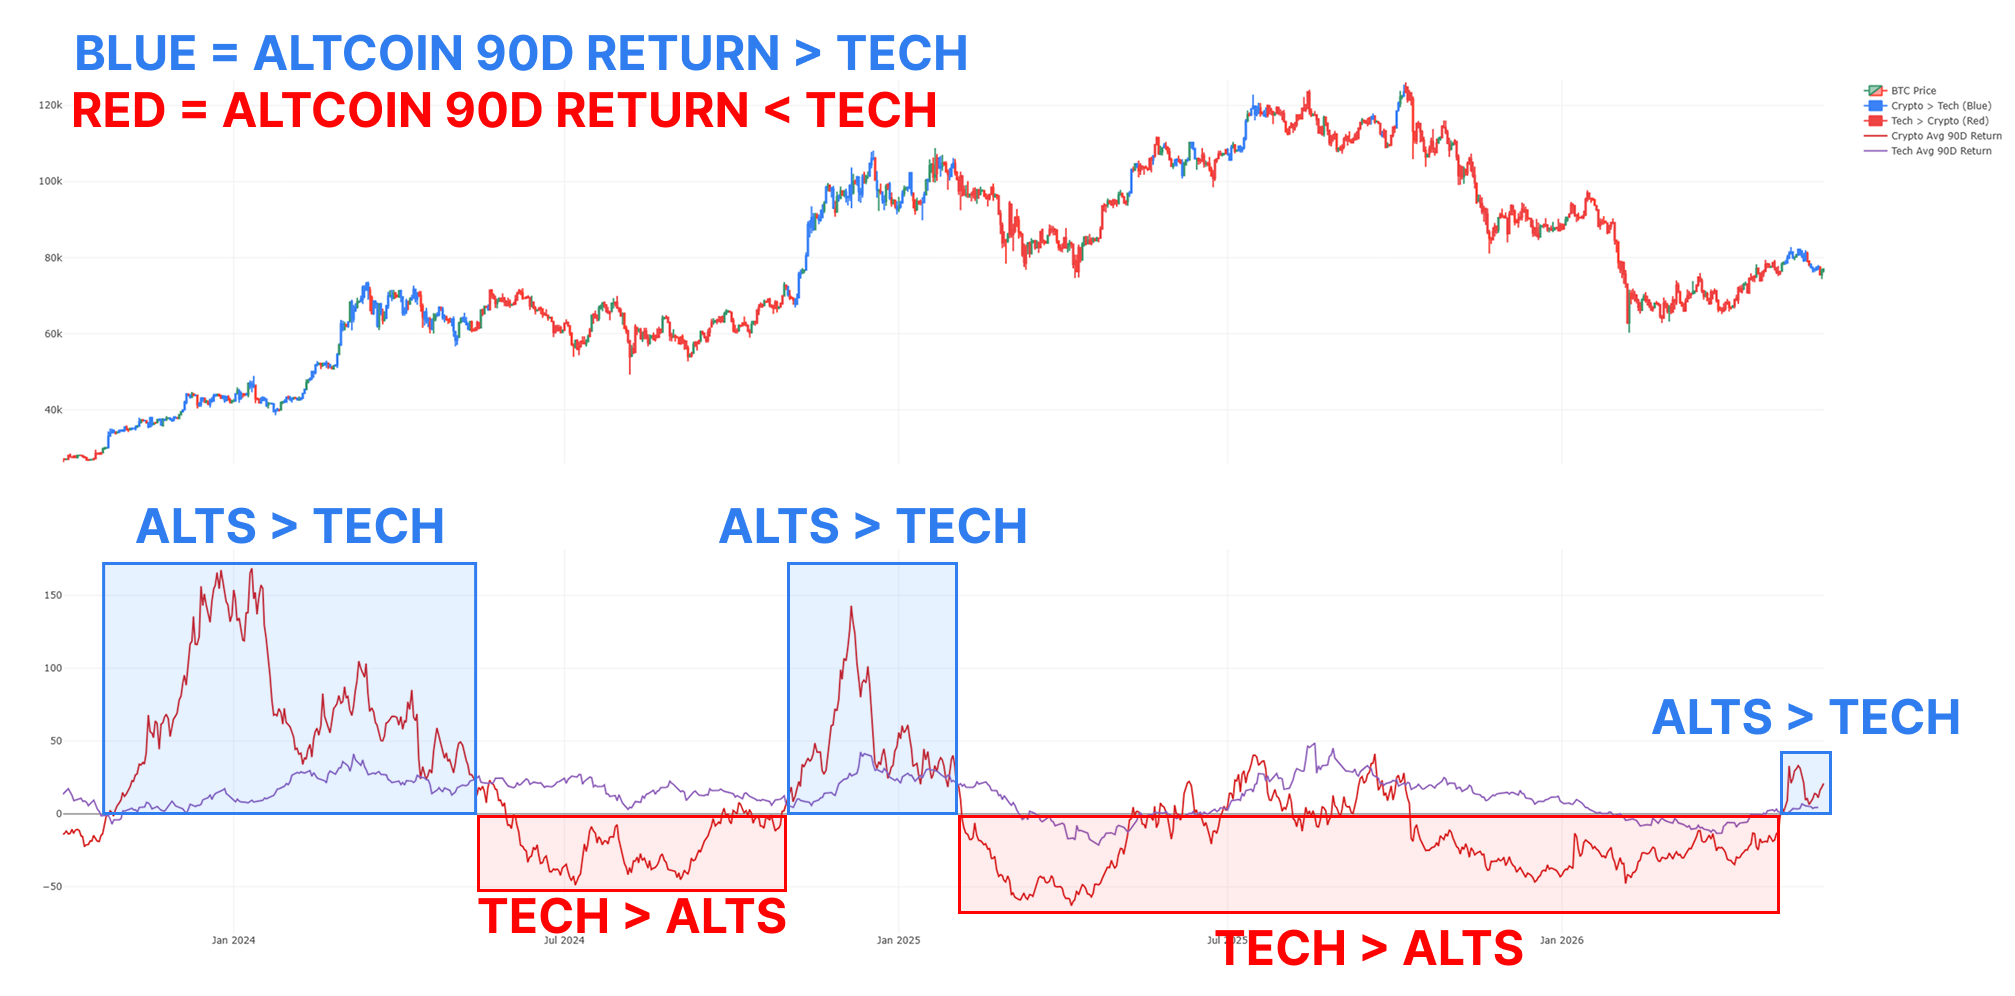
Positive returns are great, don’t get me wrong.
But we all know that you want to be invested in the fastest horses, which is where the cross asset class comparisons come into play.
In crypto’s case the most common substitute that people discuss is Tech equities.
Periods where Altcoins are outperforming Tech are the true boom periods, which is what the current data is suggesting.
Altcoins are quietly performing better.
Undoubtedly (and understandably) there are people who remain Crypto bears, and might wonder if there have even been signs of a capitulation.
There’s no way to ever know if enough blood has been spilled, but there are ways to identify:
A lot of people are puking / assets are oversold, and…
The bear trend has lasted for a long time
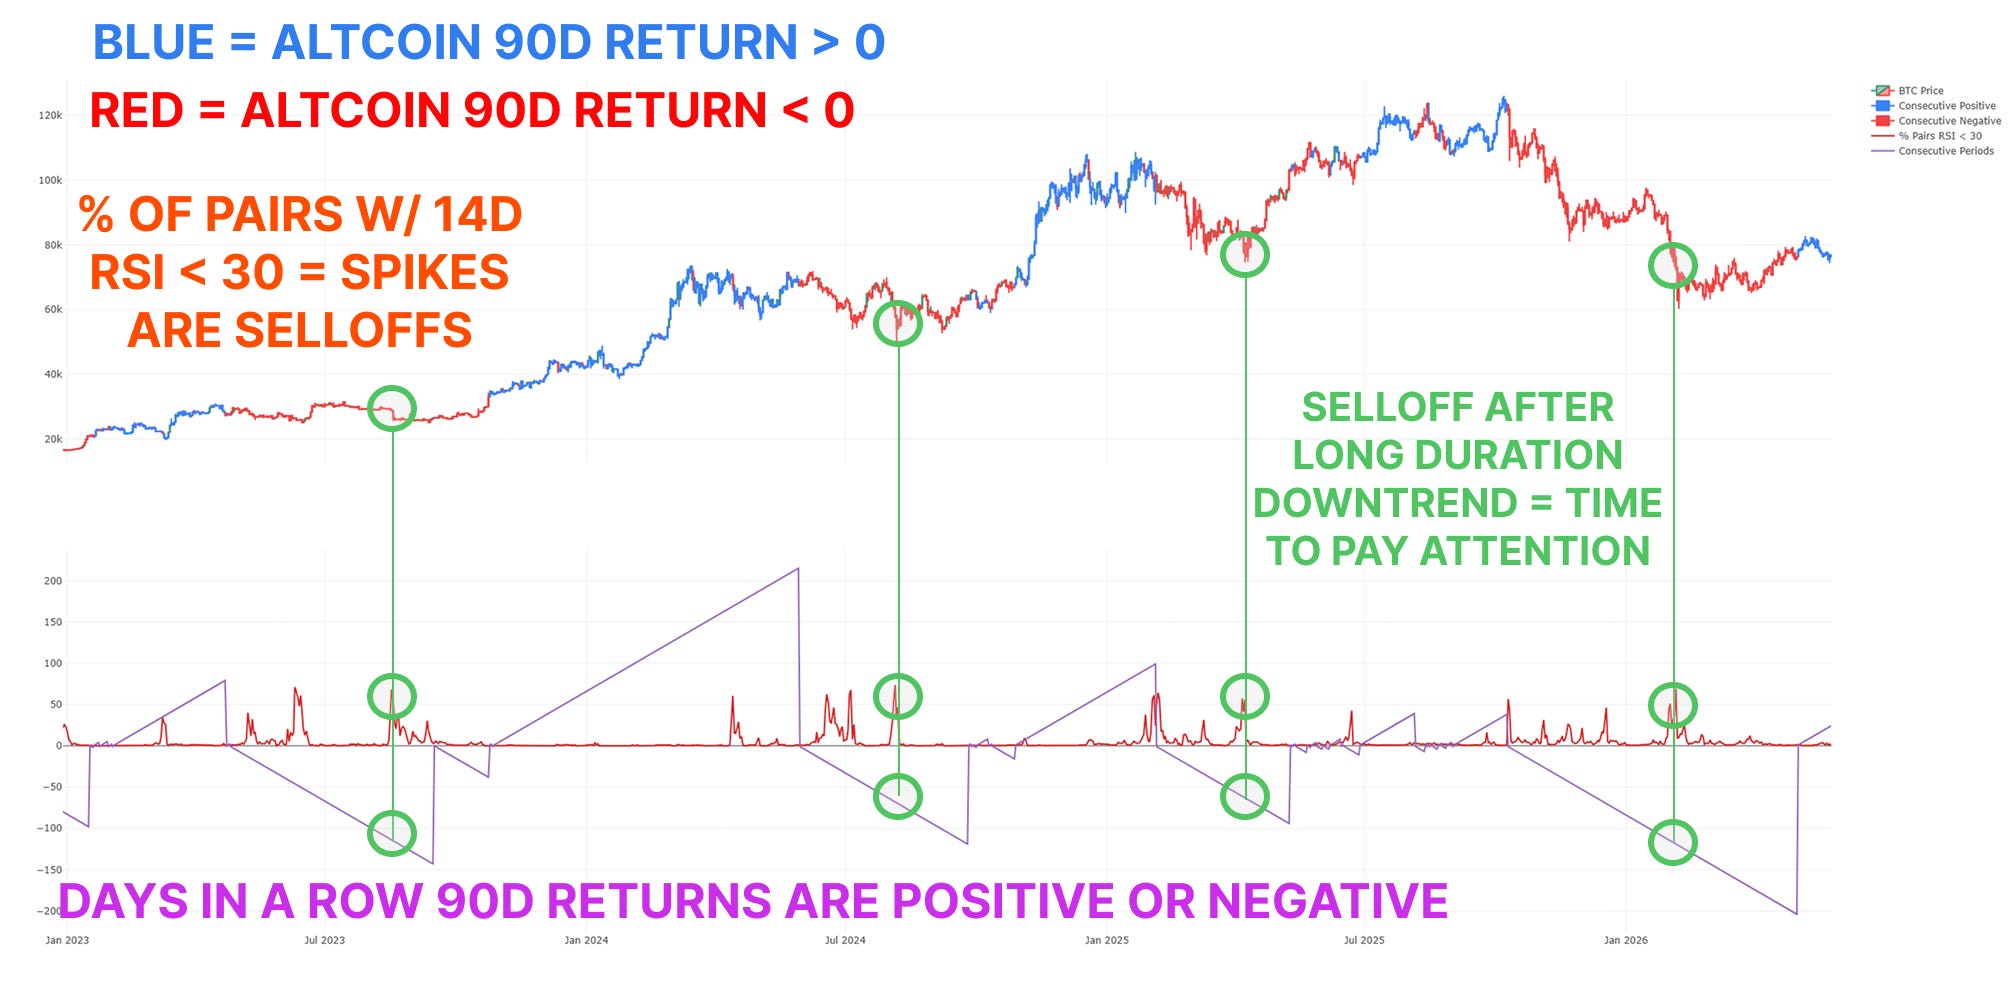
That was the goal when the chart above was constructed, which displays:
Days in a row Altcoin returns have been positive (+ values) or negative (- values) and…
The % of assets that have an oversold RSI reading (< 30)
The green circles map historical areas where you get this collision of trend duration + market-wide puking kicking in, with the most recent significant reading occurring late January / early February 2026.
In my opinion, the bear trend had its time to play out, and with a late nasty selloff to cap it all off.
PORTFOLIO UPDATES
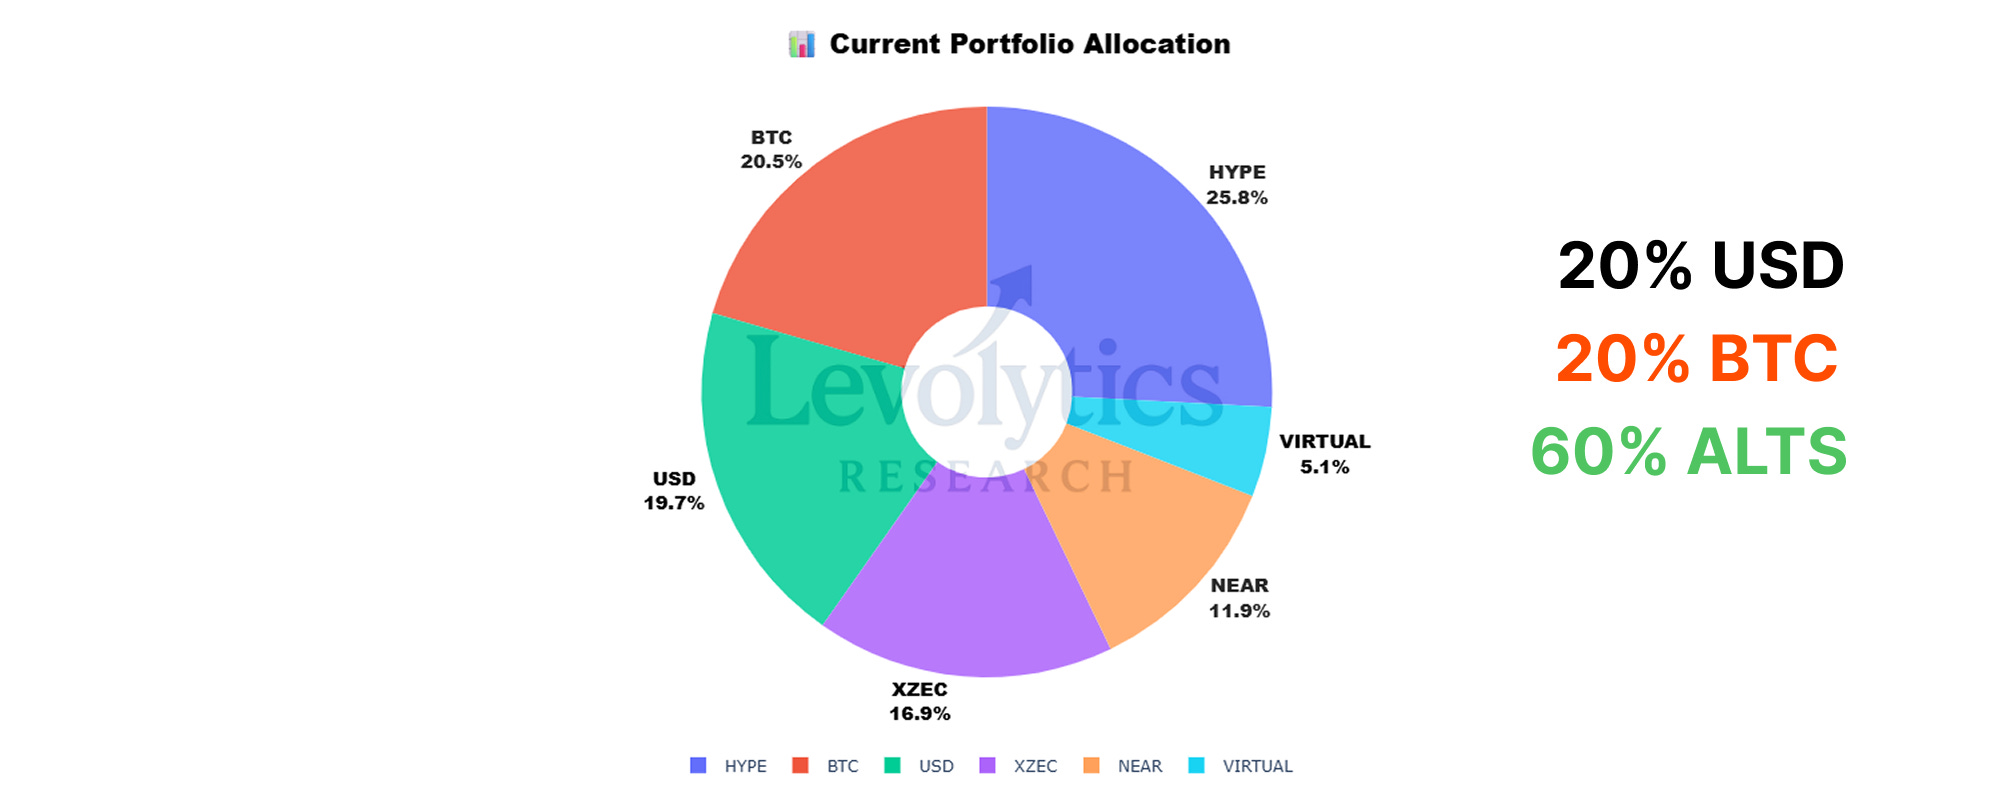
No crazy changes here folks. Altcoin allocations are in the leaders ZEC, HYPE, and NEAR.
If the market breaks out I believe VIRTUALS will move violently.
BTC allocation remains as is until ETH or SOL begin to outperform.
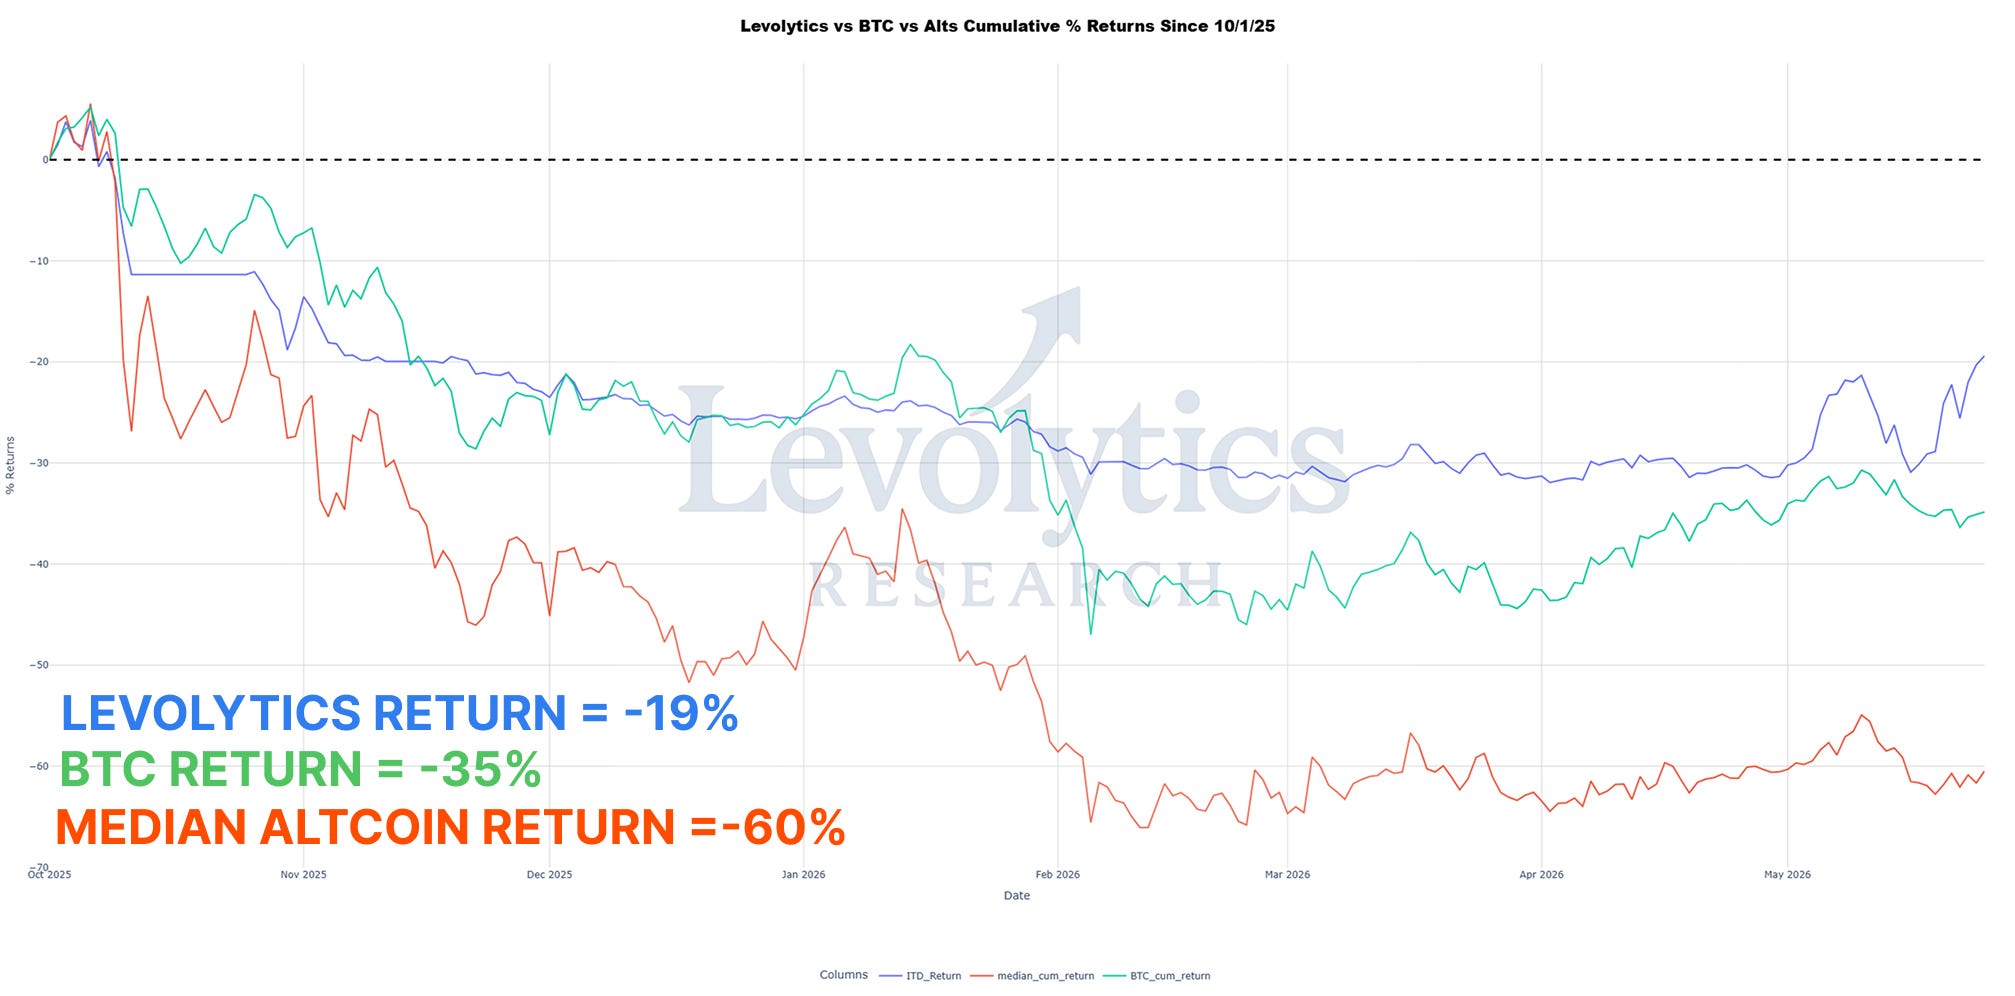
Our altcoin allocations have performed well over the past week, and we’re the closes we’ve been to breakeven since mid November 2025.
At the moment the focus is to compound good decisions and take things as they come.
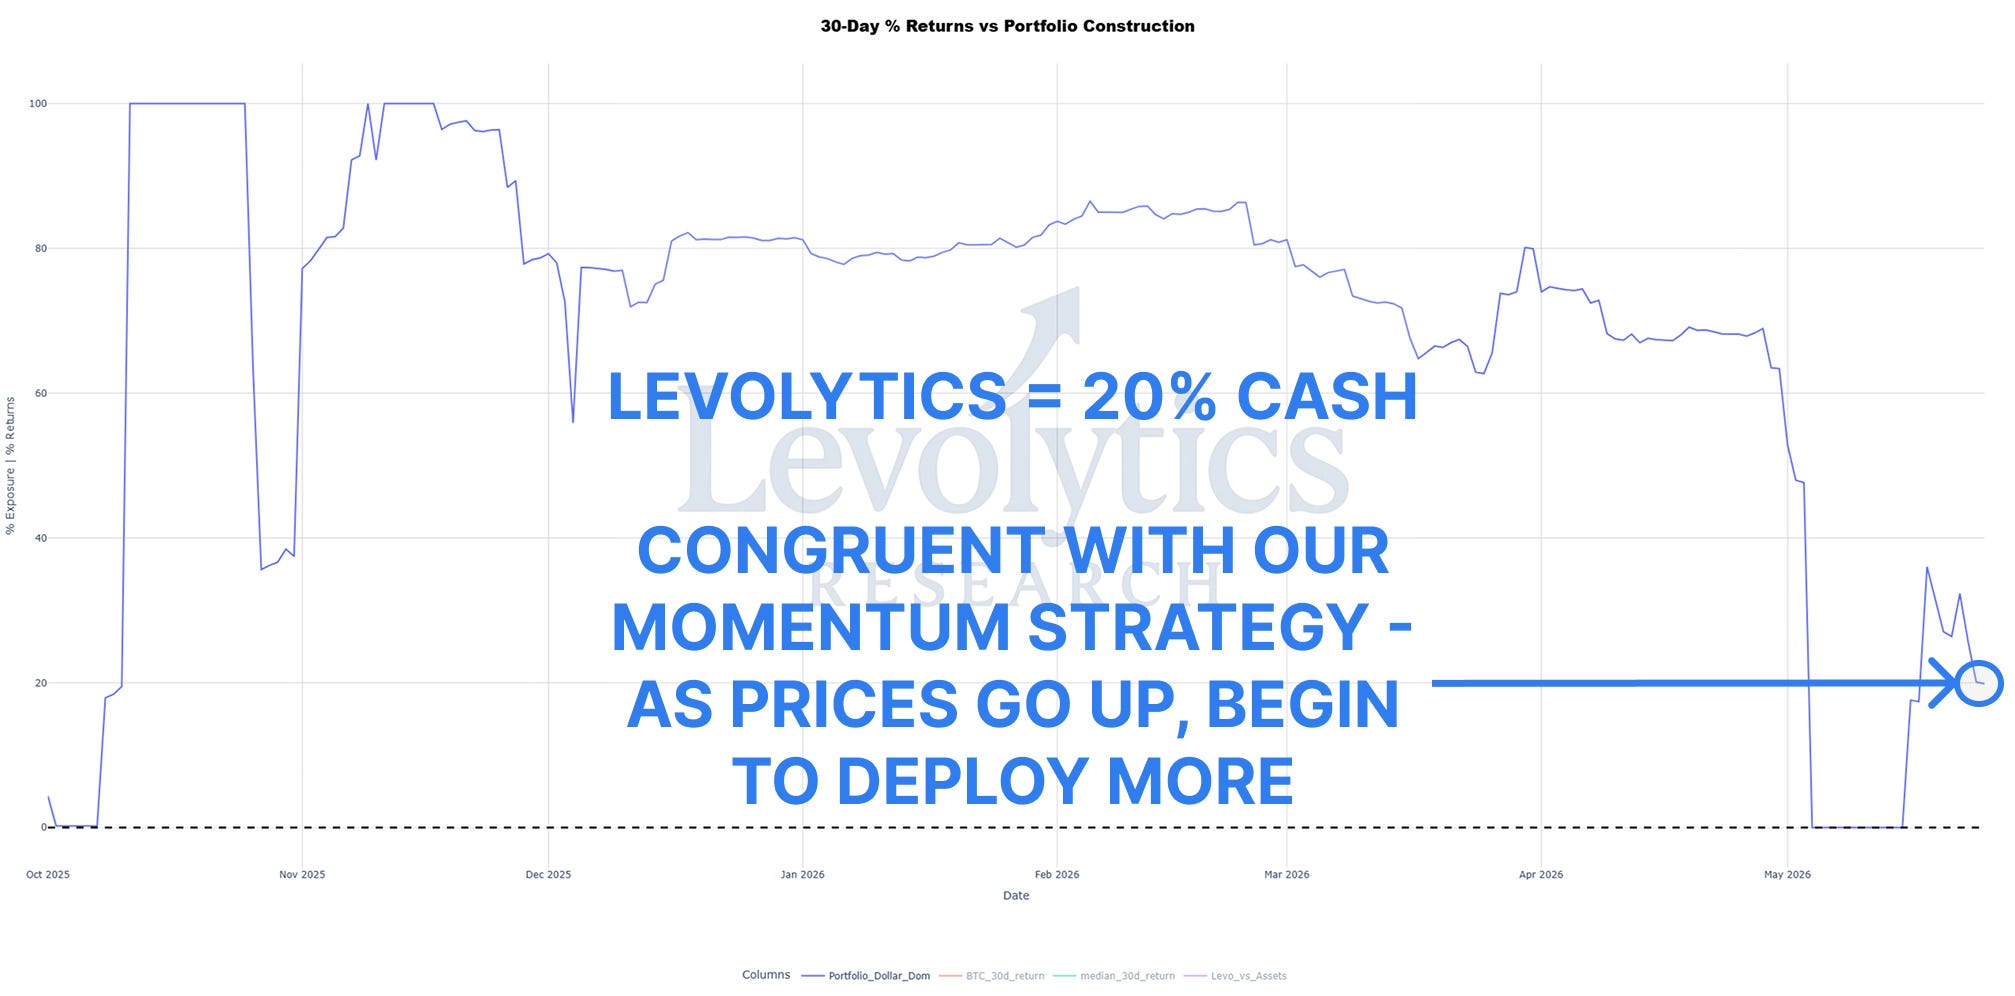
Our cash deployment strategy has lived up to my plan, so that’s another encouraging sign.
It’s one thing to make a plan, but it’s a whole other thing to go out and execute it.
Feel good about it.
CLOSING STATEMENT

Can the bulls take us higher?
We will see. However - the trend seems to be their friend at the moment.
Risk takers have returned to Crypto, now it’s time to see if they get turned away by the doorman.
DISCLAIMER
The performance results presented herein reflect proprietary trading activity conducted with internal capital only. No external capital is managed, accepted, or solicited. These results are unaudited and are provided solely for informational and research purposes.
Performance data represents the return on internal capital based on realized and unrealized gains and losses, net of trading fees and transaction costs, but before any taxes or potential operating expenses. The methodology used to calculate performance has been applied consistently; however, results have not been verified by any independent party.
Past performance is not necessarily indicative of future results. All investments involve risk, including the potential loss of principal. The information contained herein does not constitute an offer to sell or a solicitation of an offer to buy any security, investment fund interest, or other financial instrument.
Any opinions, estimates, or forward-looking statements are subject to change without notice and are provided for illustrative or educational purposes only.