
Exploring Crypto market regimes by using 90D returns and 90D change in perpetual swaps open interest
A simple method to understand what's going on under the hood in Crypto markets

Crypto markets are evolving at a rapid pace, and the task of analyzing the market in real time is naturally complicating as blockchains spread their tentacles into new pockets of the financial world.
The goal for today’s topical article is to buck this trend, and get back to basics by zooming out and studying 4 different market regimes based on (1) altcoin 90D returns and (2) altcoin 90D change in perpetual swaps open interest.
We will kick things off by establishing basics, then merge the 2 metrics to identify and better understand the mechanics of the following market regimes:
Levered pumps
Spot driven rallies
Deleveraging periods
Periods of what is likely complacent shorting
TLDR
• Crypto markets can broadly be separated into 4 major regimes by comparing altcoin 90D returns against 90D changes in perpetual swaps open interest.
• This framework helps identify whether market moves are being driven by:
spot demand,
expanding leverage,
deleveraging,
or aggressive short positioning.
• Spot-driven rallies (price outperforming positioning growth) have historically produced some of the strongest and healthiest upside trends.
• Levered rallies (open interest growth outpacing returns) have frequently appeared near local tops and periods of speculative excess.
• Deleveraging regimes tend to align with market stress, liquidations, and broad risk reduction across crypto markets.
• Current market conditions continue to resemble a spot-driven rally regime, suggesting upside may still be occurring with relatively restrained speculative positioning beneath the surface.
VIDEO VERSION OF ARTICLE (31 MIN)
THE BASICS: RETURNS & PERPS OPEN INTEREST
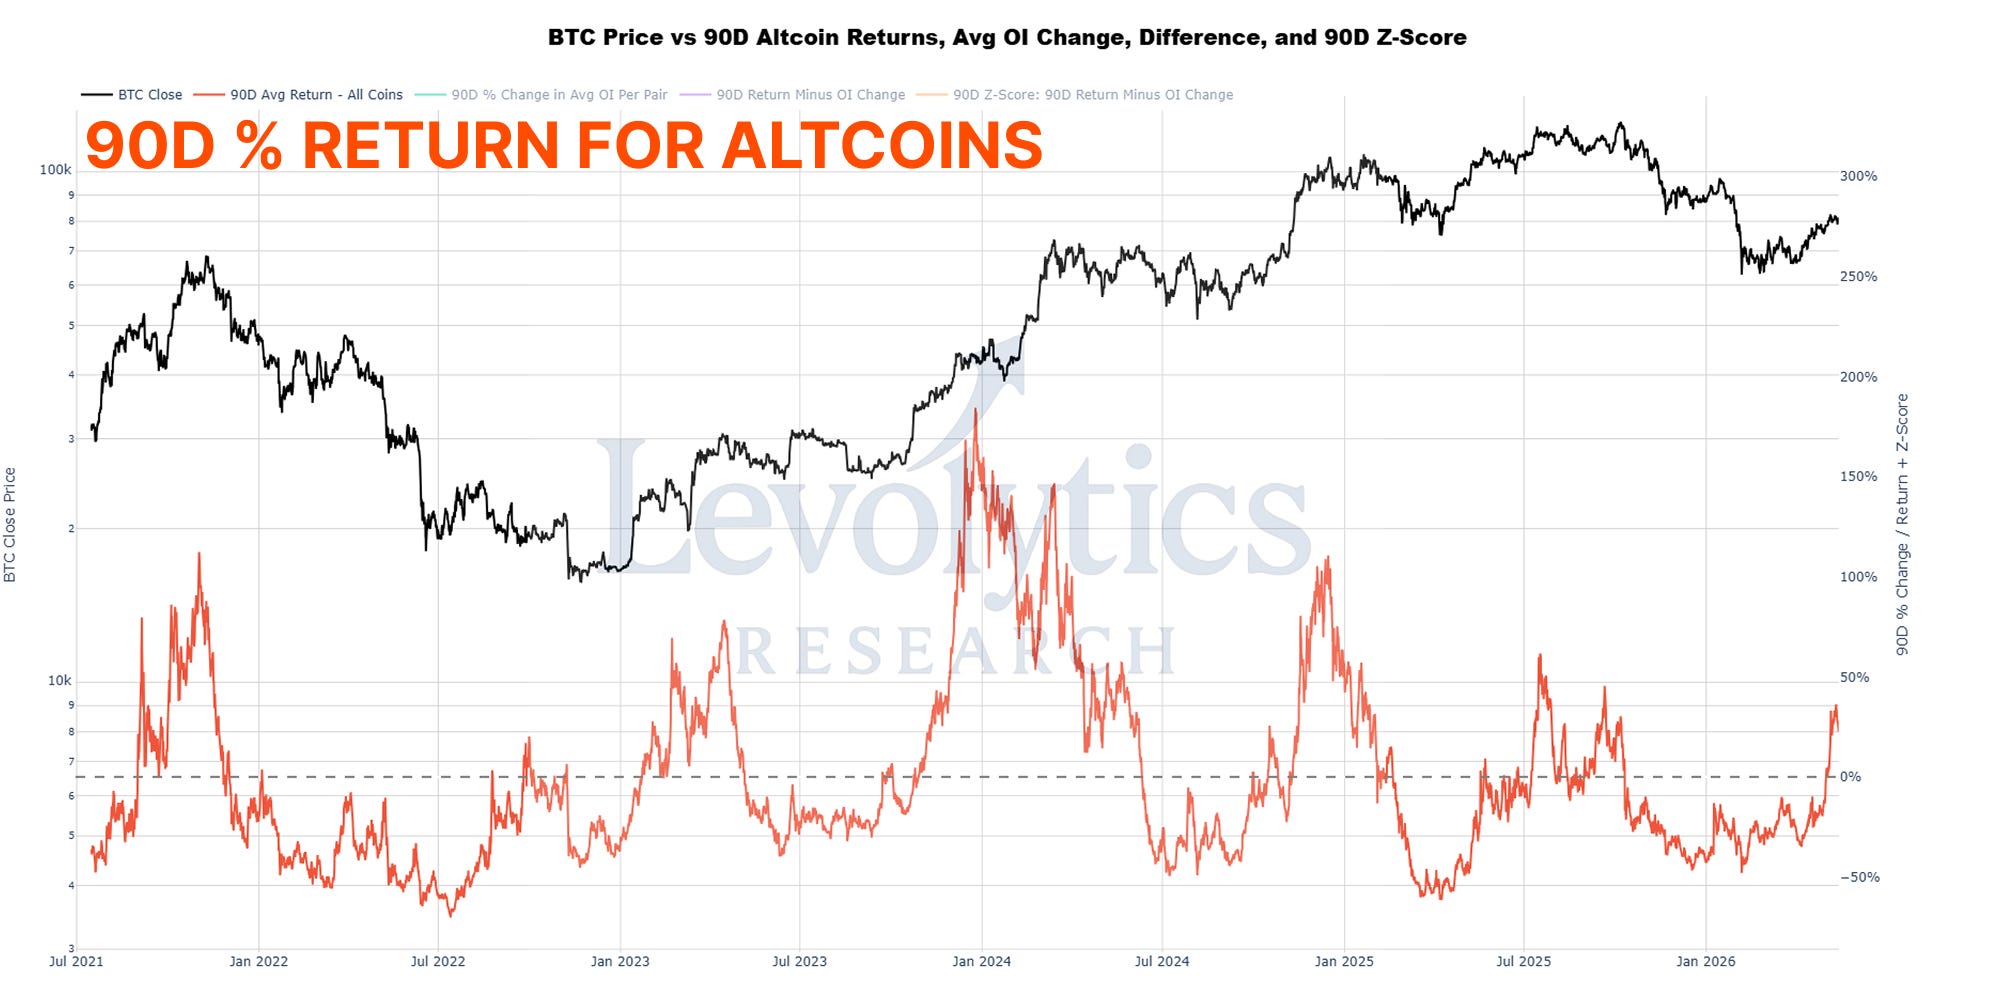
I’m not going to insult your intelligence here, so let’s keep things simple with a few bullet points:
90D % returns for altcoins = the average return across all perpetual swap pairs on Bybit
Returns are driven by one single factor: PRICE
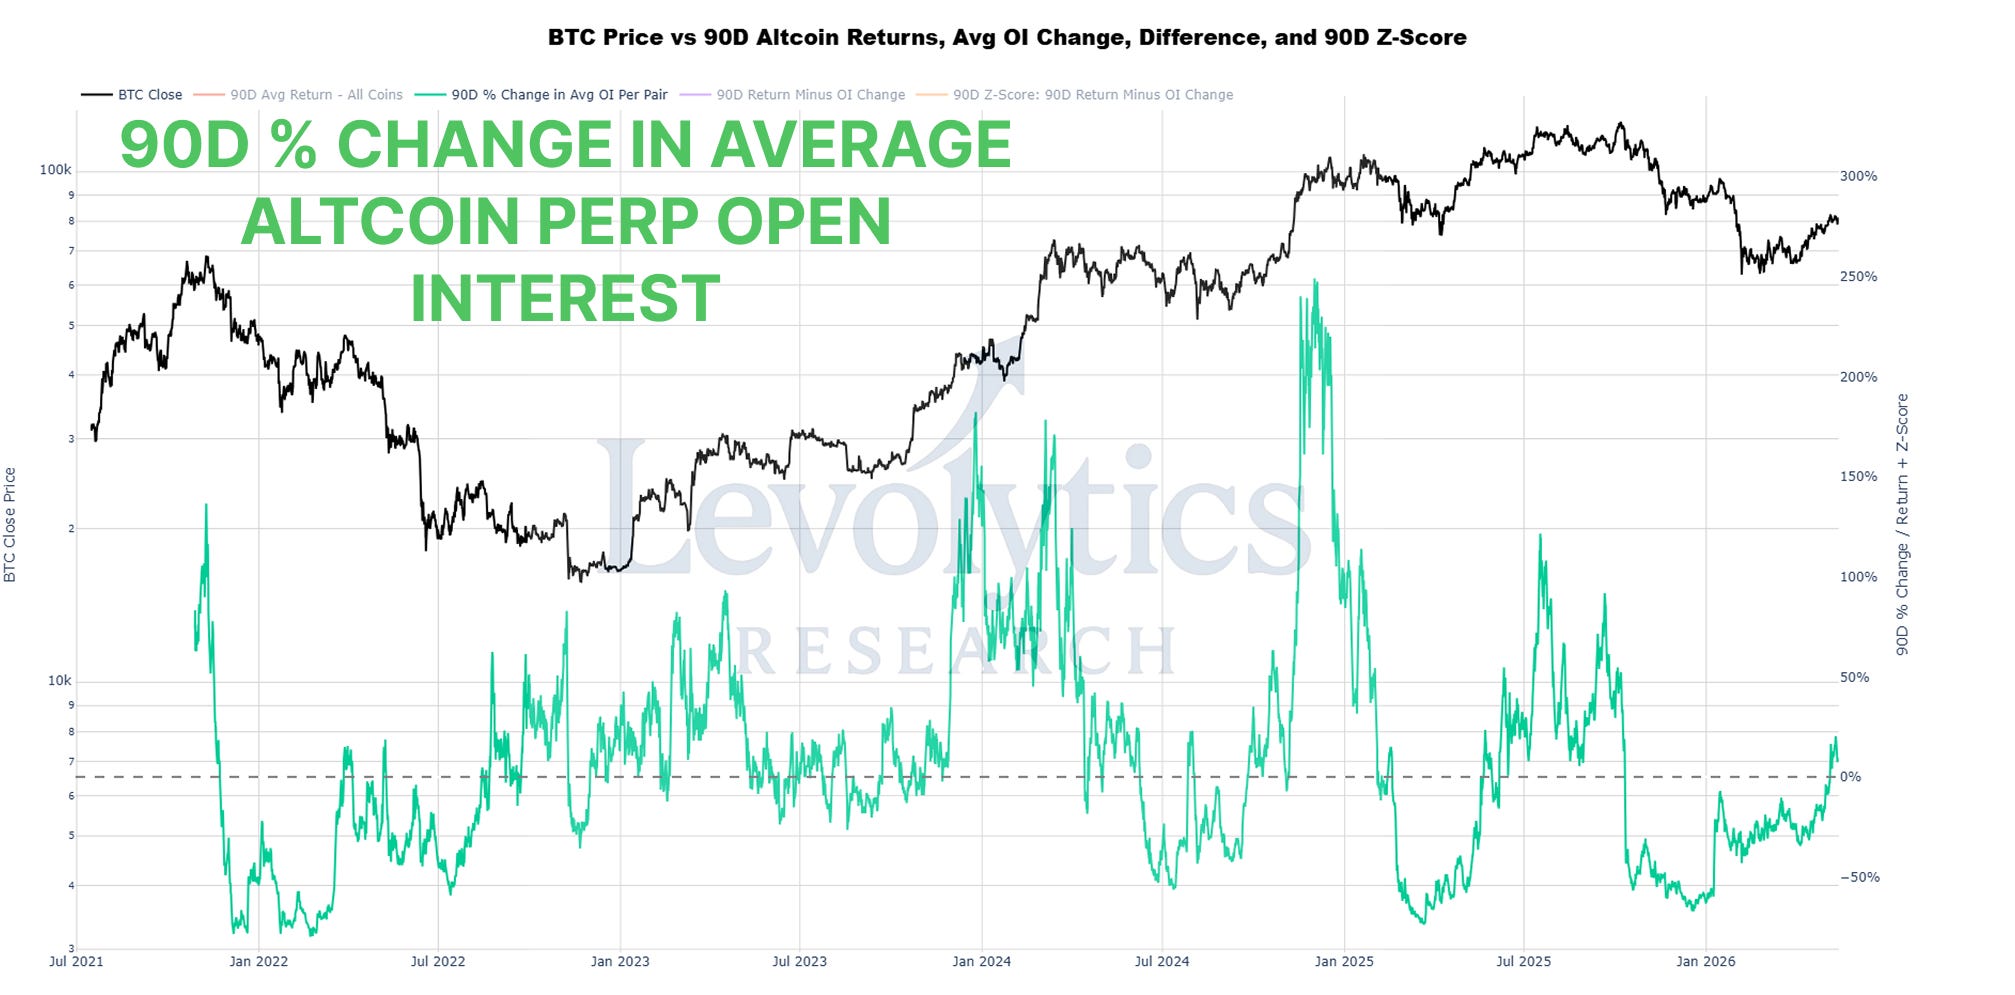
Perpetual swaps open interest requires more of our time because it is naturally more complicated. Some readers might not even know what it is, so we will also explain that below:
Open interest definition = total value or number of active perpetual swaps contracts that are OPEN and have NOT been closed
90D % change in average altcoin open interest = across all perpetual swap pairs on Bybit
This calculation is an average of the DOLLAR value of altcoin perpetual swap pairs
Change in the dollar value of open interest is driven by (1) PRICE and (2) OPEN CONTRACTS
INTRODUCING: RETURNS VS OI DELTA (ROI DELTA)

Remember that PRICE is a driving factor in both 90D returns and 90D change in open interest. Thus, comparing the two metrics helps partially normalize the effect of price appreciation and better isolate whether market moves are being accompanied by expanding or contracting perpetual swaps positioning.:
Positive values = Contracts were net closed over the period
Negative values = Contracts were net opened over the period
Keep in mind that all these coins have different supply units, which makes combining their contract values difficult. Thus, this calculation provides a simple, yet effective proxy for market-wide expansion and contraction in perpetual swaps positioning.
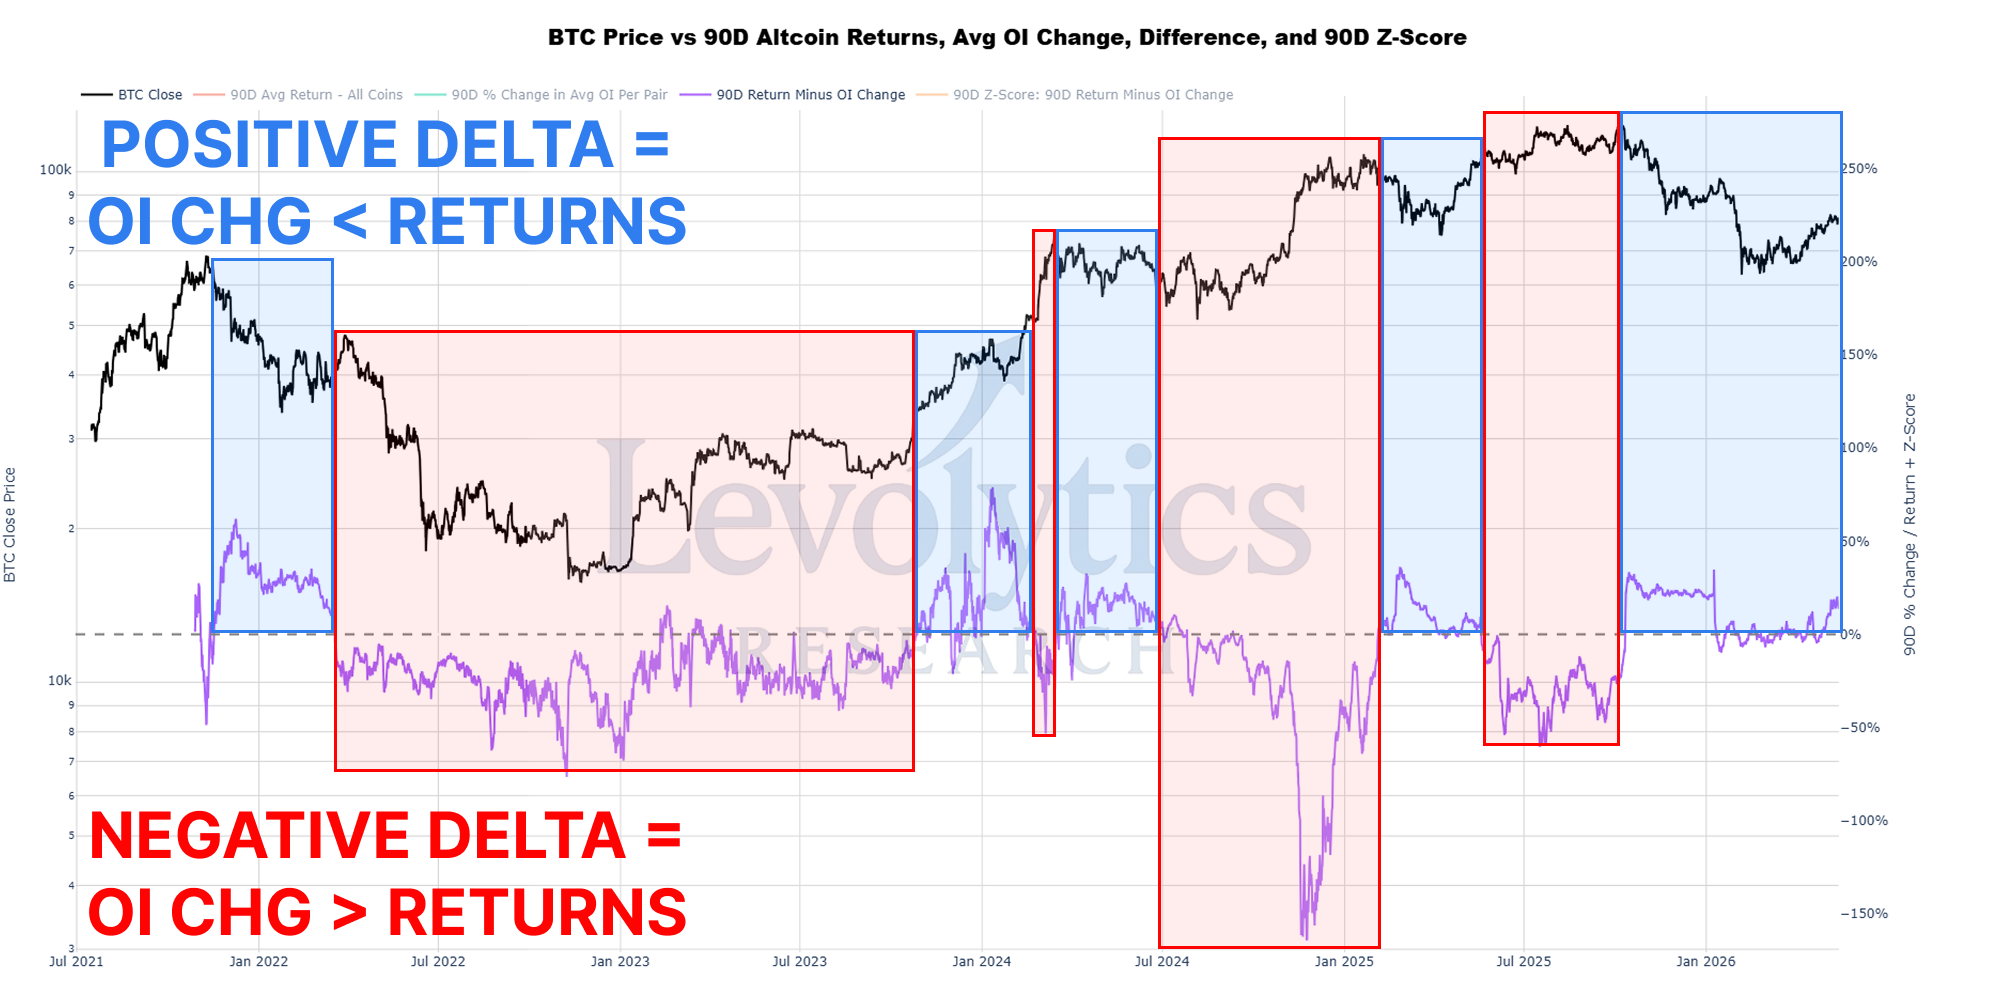
The first 4 boxes above display (from left to right):
A deleveraging event at the beginning of 2022, the beginning of the Crypto bear market
Persistent perpetual swap activity throughout the bear market, with a few events where longs were caught offsides (more on these later)
A spot driven rally after the BTC ETFs got approved in late 2023, after shorts were caught offsides (which accumulated during Summer 2023)
Blow off top in Spring 2024 with traders getting overleveraged
In the next section we will add some context that helps us better understand these examples.
INTRODUCING: ROI DELTA VS RETURNS
Now we have arrived at the meat of our analysis.
By comparing returns and the ROI Delta, we can gauge the following:
How did price perform during the period (bull or bear)
And if the contract flows were positive or negative
Before looking at the charts, the easy way to remember each combination is as follows:
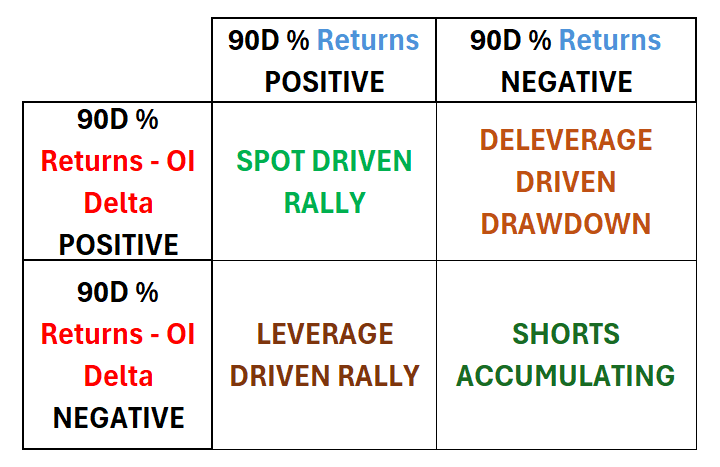
A brief explanation of each is worthwhile, just to make things very clear from a logic perspective:
Spot driven rally =
Positive 90D returns
Positive ROI Delta means that 90D returns > 90D change in open interest, signaling that perp contracts must have closed over the period
Note: this is the rarest market regime
Leverage driven rally =
Positive 90D returns
Negative ROI Delta means that 90D change in open interest > 90D returns, signaling that perp contracts must have been opened over the period
Note: common near market tops
Deleverage driven drawdown =
Negative 90D returns
Positive ROI Delta means that 90D returns > 90D change in open interest, signaling that perp contracts must have closed over the period
Note: tends to occur in market shocks
Shorts accumulating =
Negative 90D returns
Negative ROI Delta means that 90D change in open interest > 90D returns, signaling that perp contracts must have been opened over the period
Note: defining characteristic of the 2022 bear market, but also preceded the 2023 ETF pump and the 2024 US presidential election pump
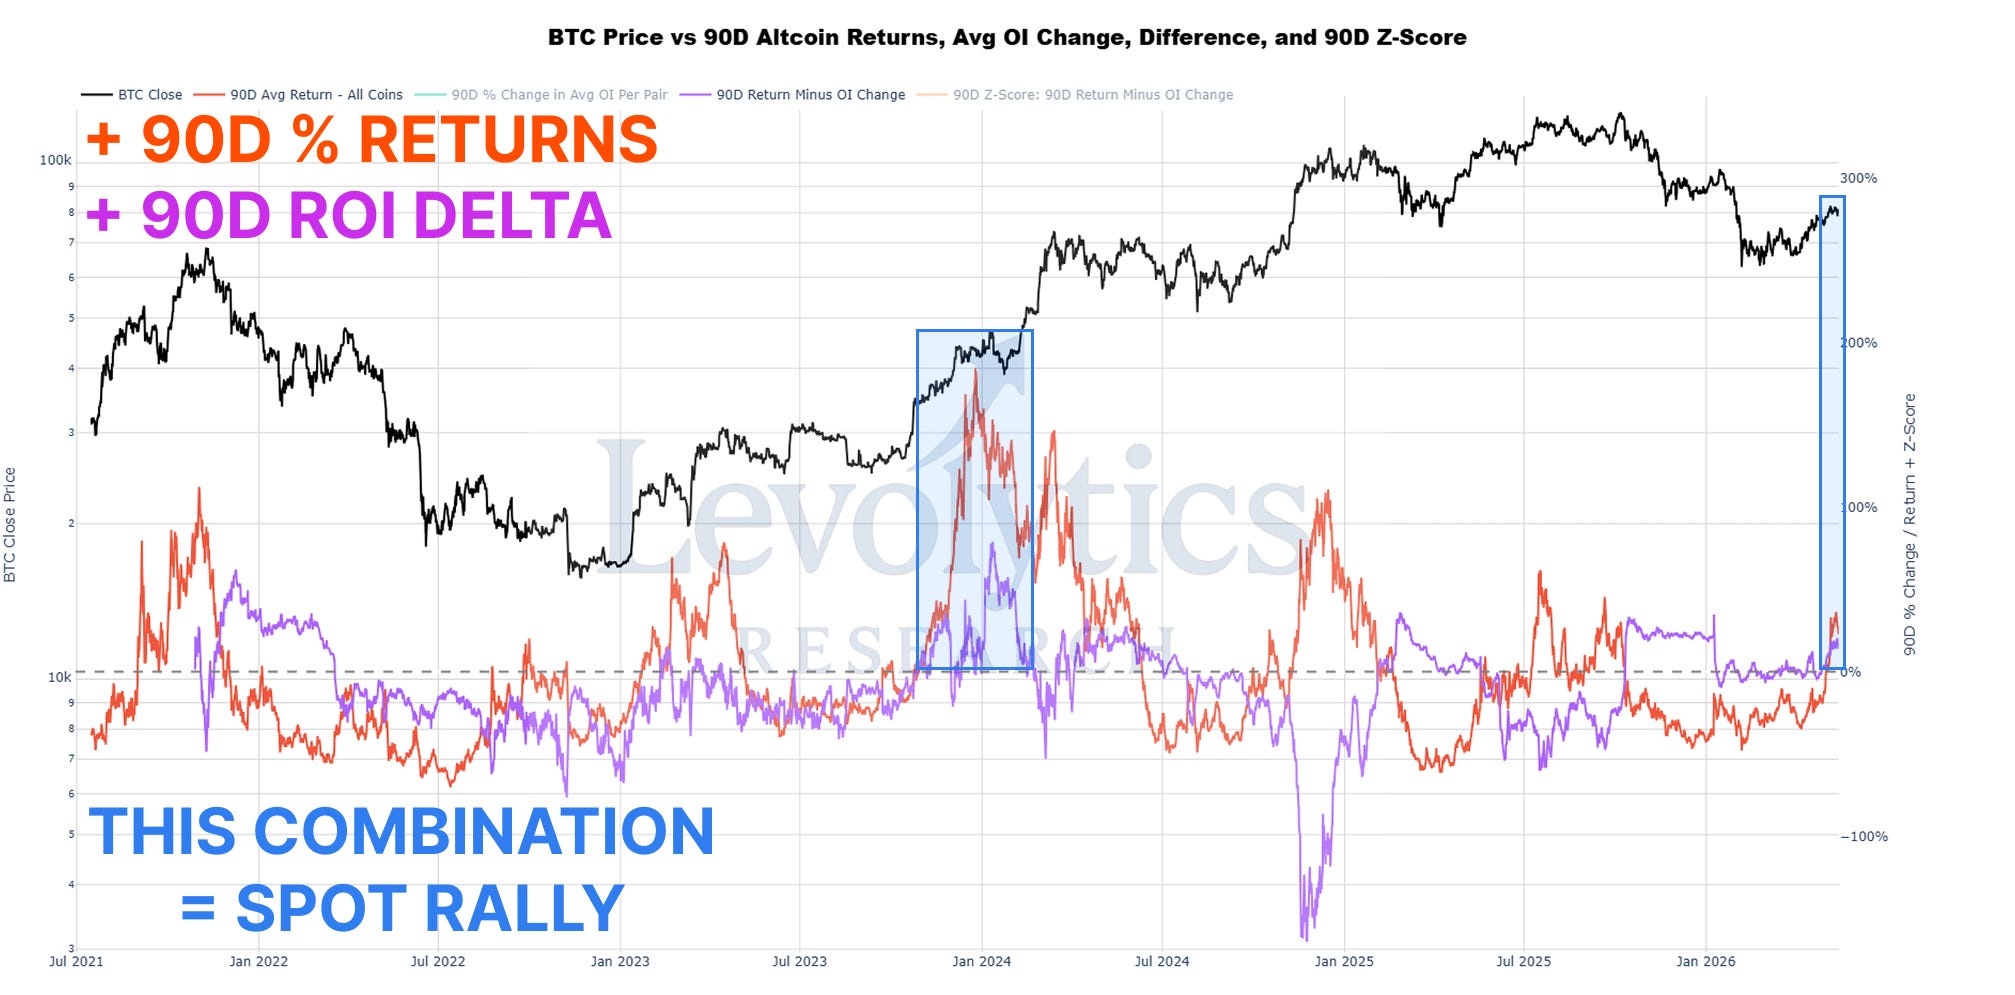
This data set is limited in size, but it’s not surprising to see that the last bull’s most powerful rally landed in the spot rally bucket.
These “spot rallies” are what you want to see / take advantage of, because contract flows are lagging price action - which can also be indicative of short positions getting squeezed as well.
The most exciting piece of information is that we are currently in the spot rally regime, we will find out soon if price action continues to move accordingly.
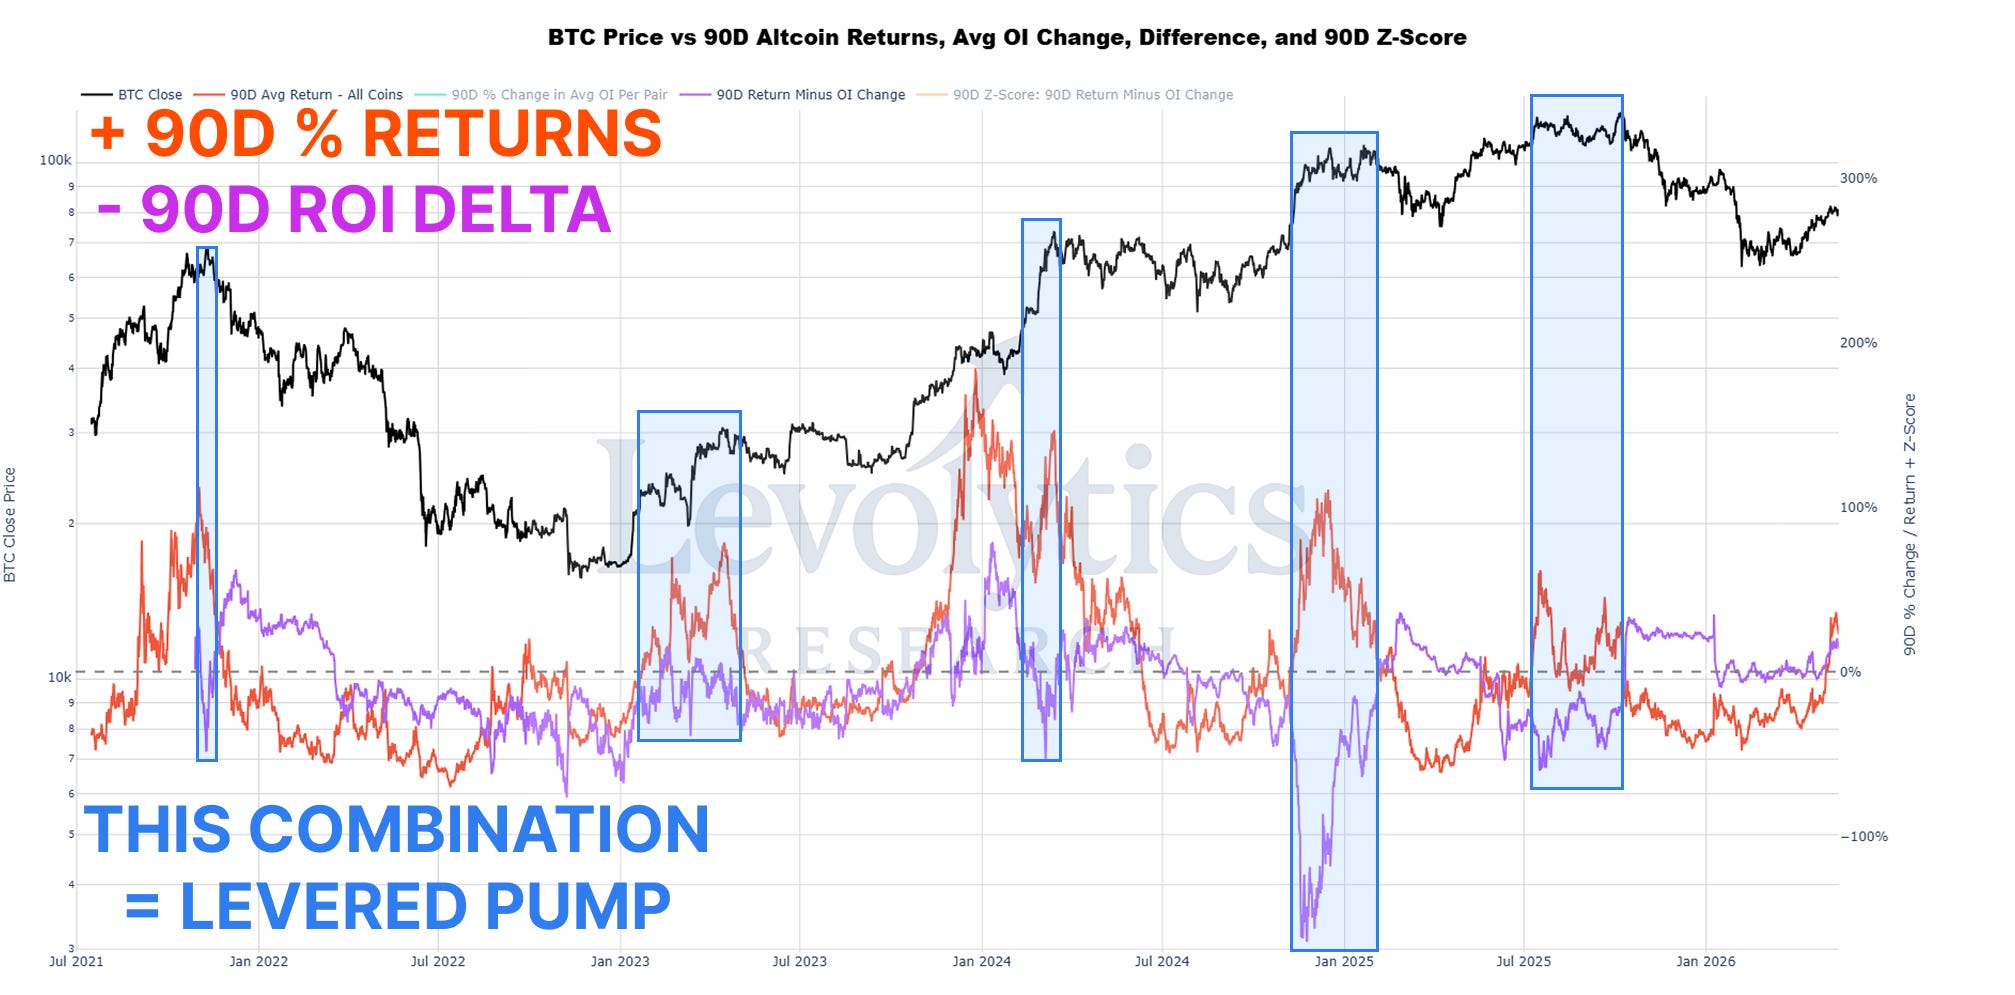
Levered pumps are easy to identify because the 90D returns and the ROI Delta are positioned / moving in the opposite directions.
Furthermore, everybody knows Crypto markets tend to get overzealous with leverage so the deep negative values for the ROI Delta create some space on the chart.
Since late 2021 this market regime has caught most significant tops.
Once the regime reveals itself it should be obvious anecdotally and on the chart.
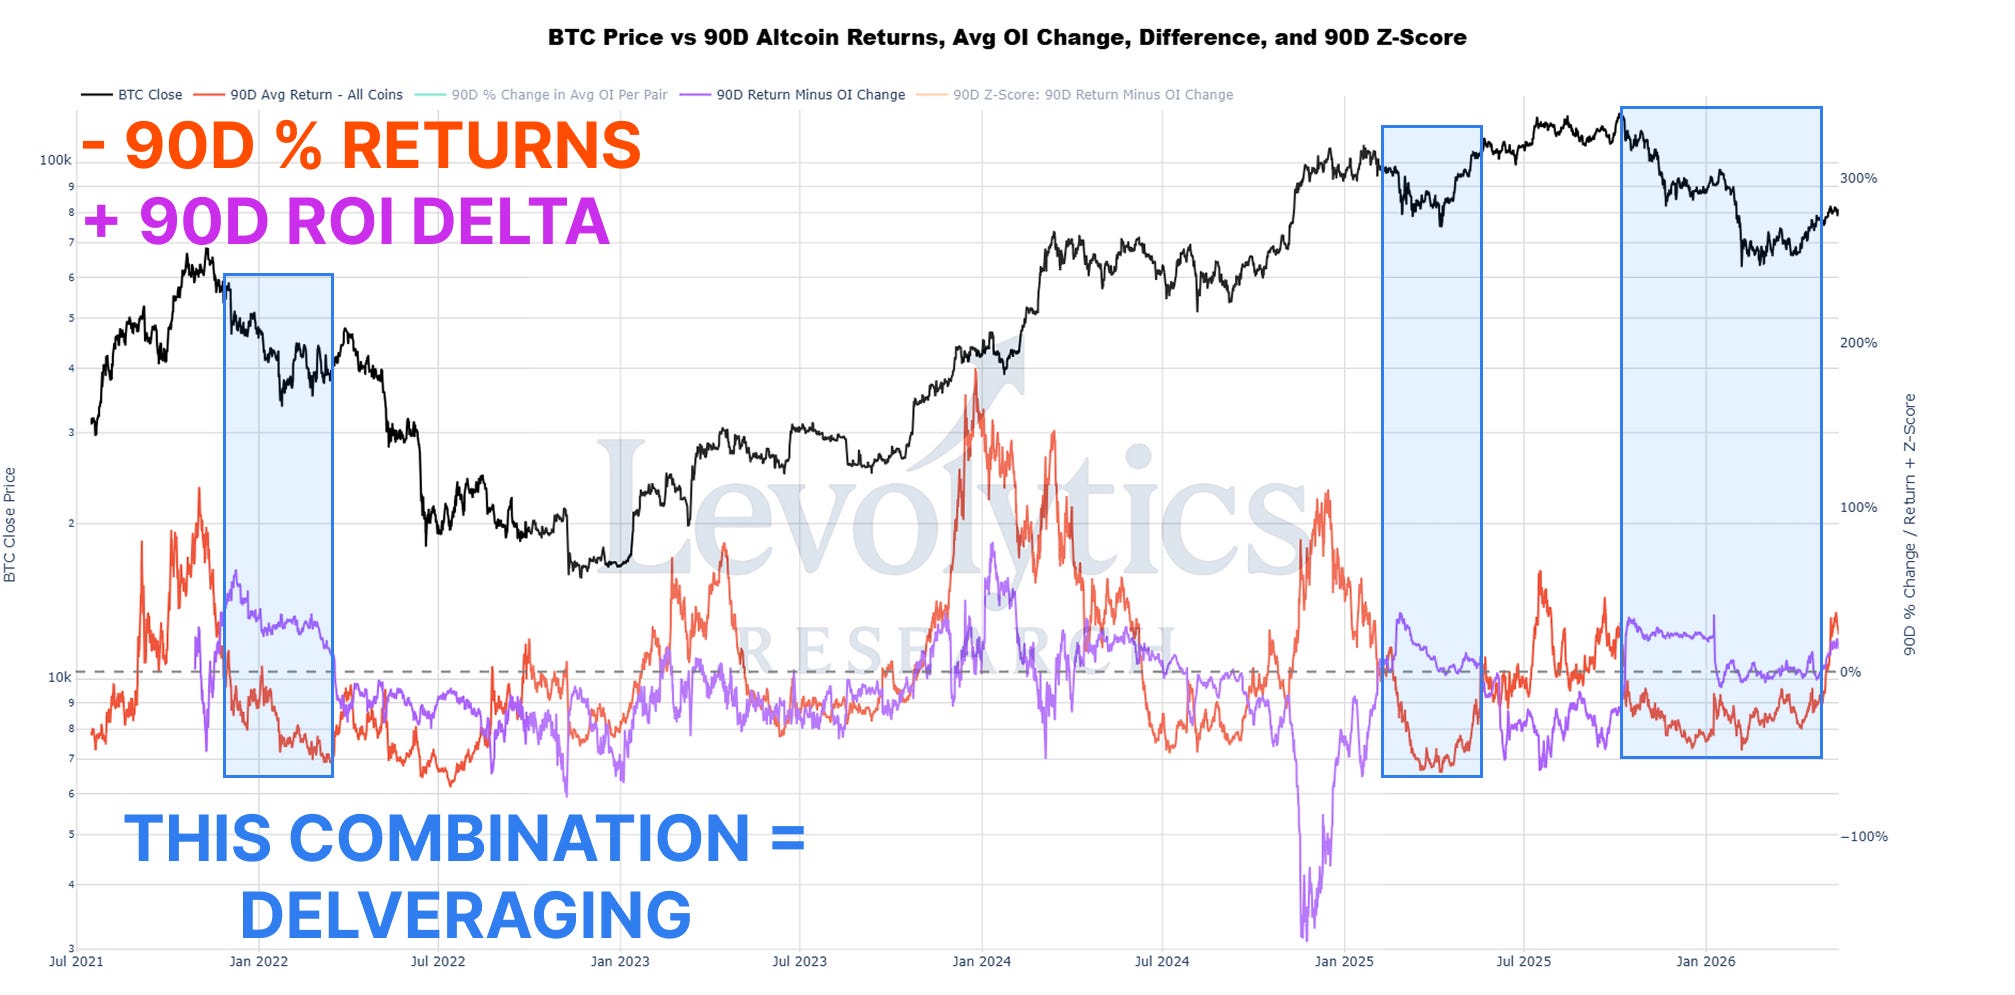
Deleveraging events sting, and are usually self evident.
These conditions aren’t ideal for taking much action besides accumulating cash.
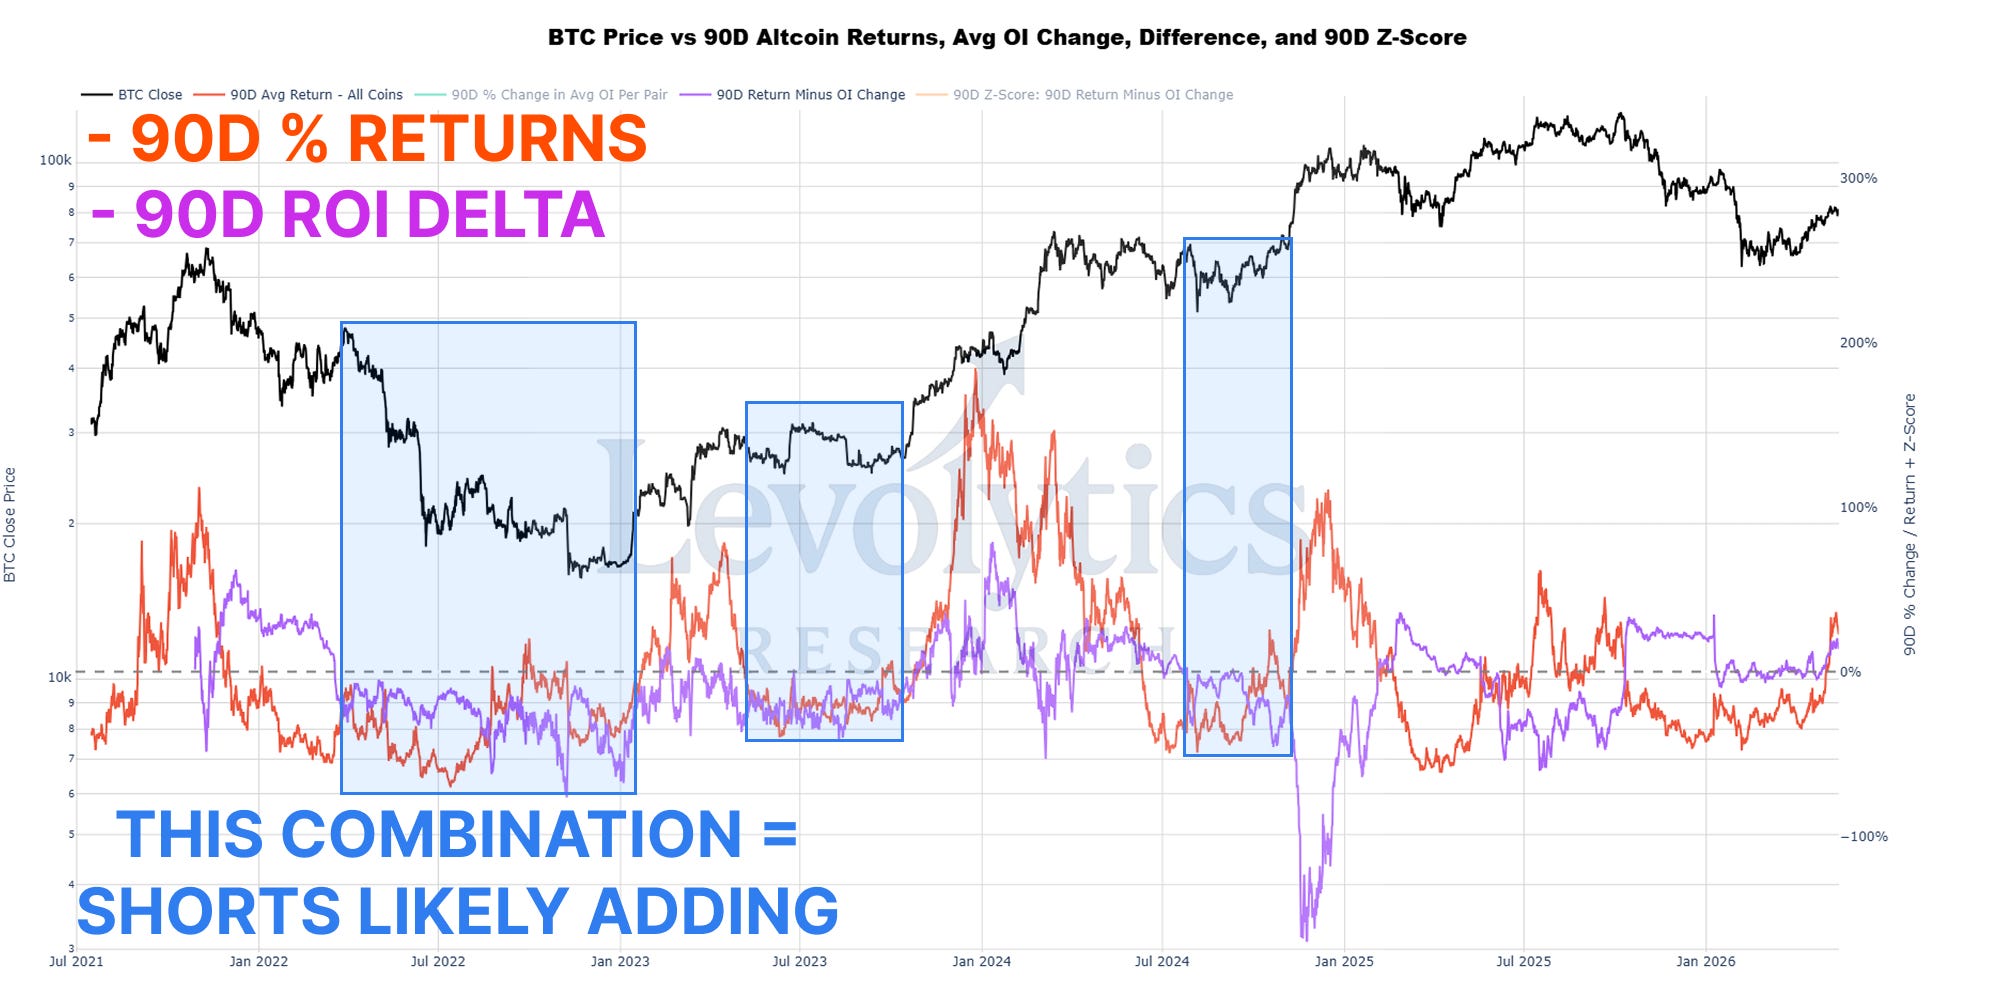
Negative returns paired with a build up in perpetual swaps positioning is a dangerous combo, and where opportunistic traders can begin to prepare for battle.
Readers will notice in the chart that I said “shorts likely adding”, because it’s not always that simple. We’ll address this in the final chart.
Otherwise on average I still consider this the waiting room for punishing aggressive bears.
CLEANING UP BLIND SPOTS: ROI DELTA Z-SCORE
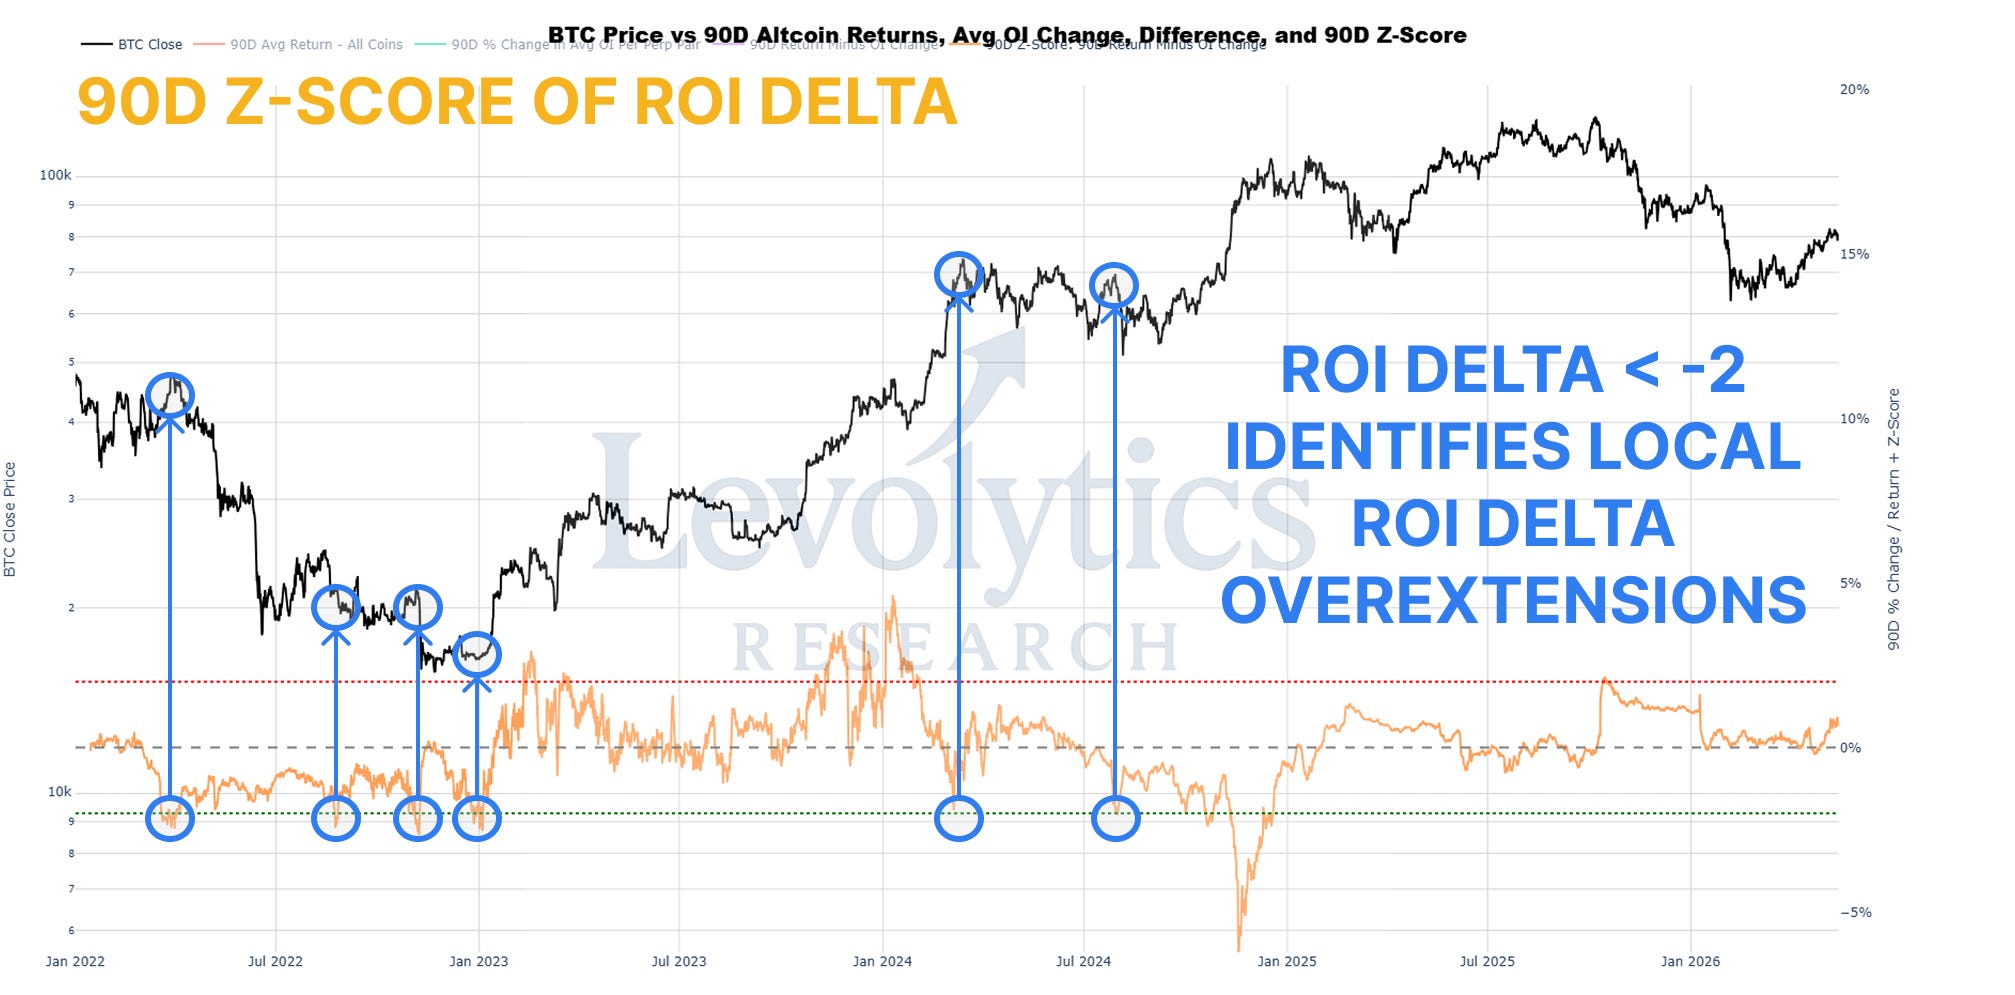
The 90D ROI Delta Z-Score can help us clean up some of our blind spots.
As I was studying the data, I realized that the 2022 bear market was a period that felt like it was difficult to navigate due to its persistent shorting regime.
However, maybe it wasn’t a shorting regime, and possibly a mix of bull getting liquidated on the way down and aggressive bear shorting.
The circles above show a few of these instances - this tool isn’t perfect (nothing is) but it’s a useful tool during expansionary open interest regimes.
SIGN OFF
That’s it for today folks.
If anything is unclear please check the video version of this article, I always provide extra color within those videos.
Have an amazing weekend!
DISCLAIMER
The performance results presented herein reflect proprietary trading activity conducted with internal capital only. No external capital is managed, accepted, or solicited. These results are unaudited and are provided solely for informational and research purposes.
Performance data represents the return on internal capital based on realized and unrealized gains and losses, net of trading fees and transaction costs, but before any taxes or potential operating expenses. The methodology used to calculate performance has been applied consistently; however, results have not been verified by any independent party.
Past performance is not necessarily indicative of future results. All investments involve risk, including the potential loss of principal. The information contained herein does not constitute an offer to sell or a solicitation of an offer to buy any security, investment fund interest, or other financial instrument.
Any opinions, estimates, or forward-looking statements are subject to change without notice and are provided for illustrative or educational purposes only.